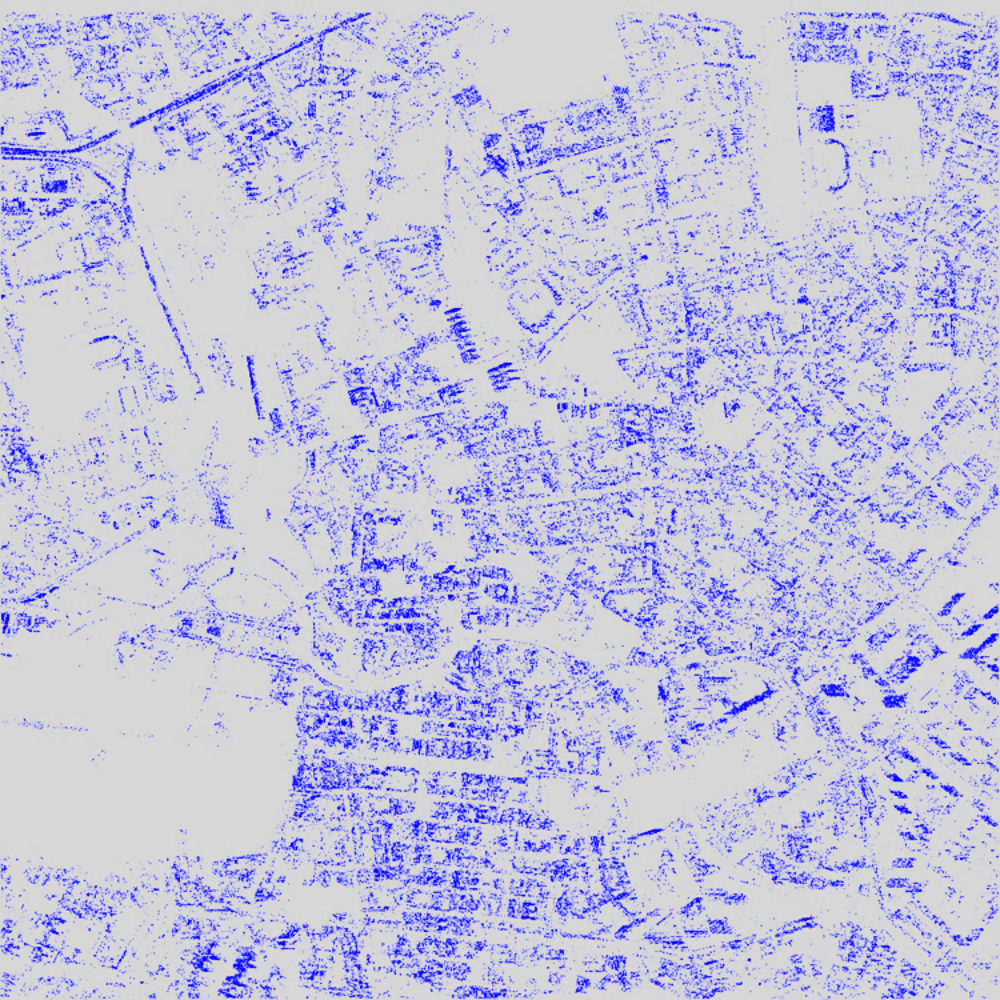
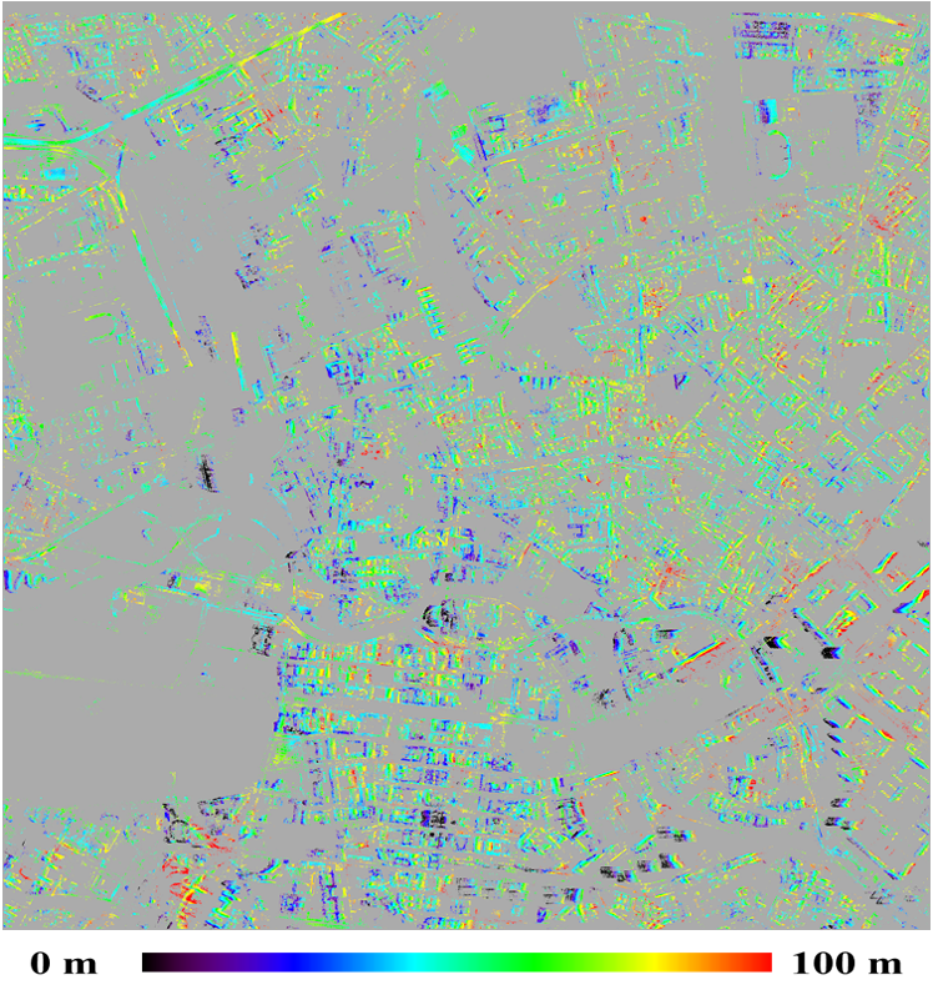
Persistent Scatterer Interferometry (PSI) detects and analyses PS points, which are characterized by strong, stable, and coherent radar signals throughout a time series of SAR images. The attributes of the PS points, such as line-of-sight velocities (mm/year level) and topography height, can be derived and used for topography reconstruction and deformation analysis in a scene of interest. In practice, PSI works particularly well in monitoring built-up cities because densely clustered PS points are anticipated to be detected from stationary buildings.
A prerequisite of forming PS points is that their signals throughout time-series SAR images must maintain coherence. To avoid coherence loss, a scene of interest covered with PS points is assumed to be steady and free of any big changes. A typical example is a building containing PS-like substructures stays unchanged over the acquisition period of an SAR image stack. Therefore, the local PS points can be extracted for further analysis. In contrast, if the substructures disappear due to construction, the local PS candidates are discarded in the initial screening of a standard PSI processing for dominant and temporally stable scatterers. In other words, big change information is unobtainable in PSI.
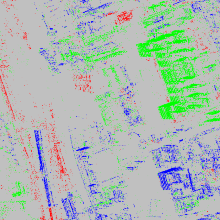
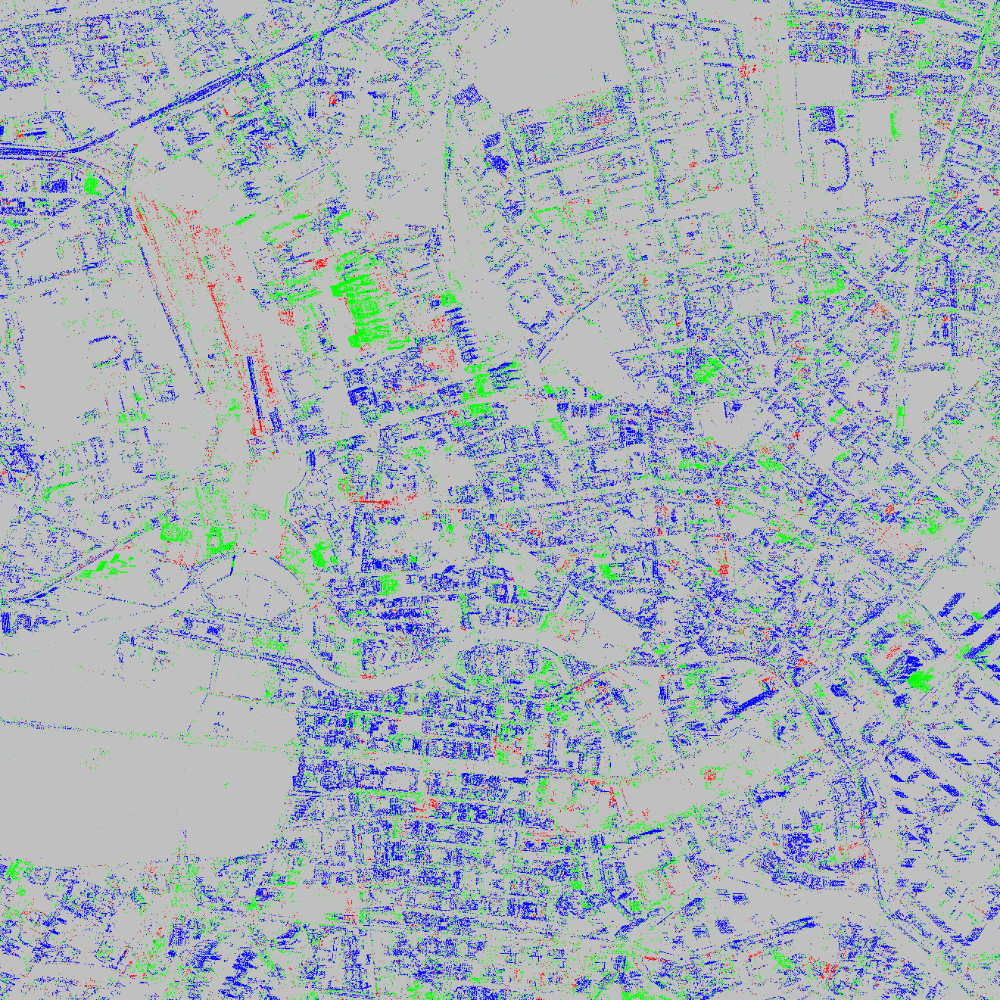
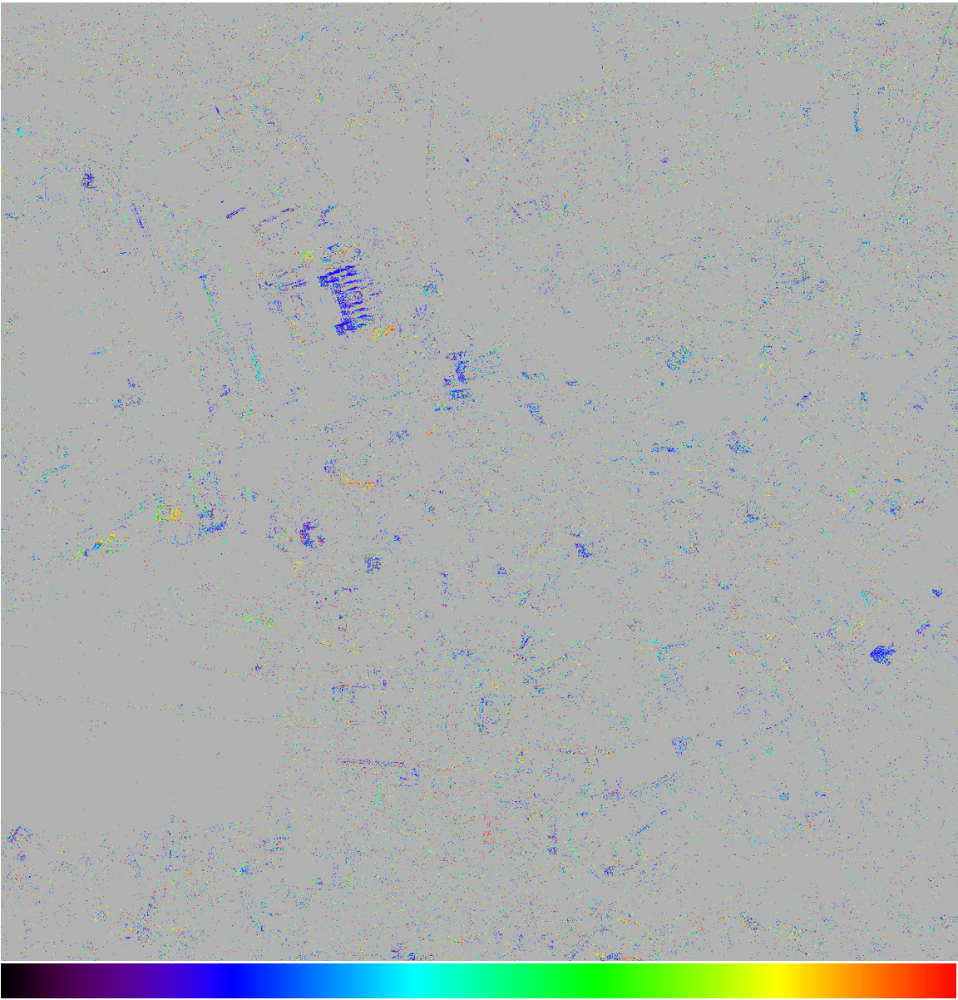
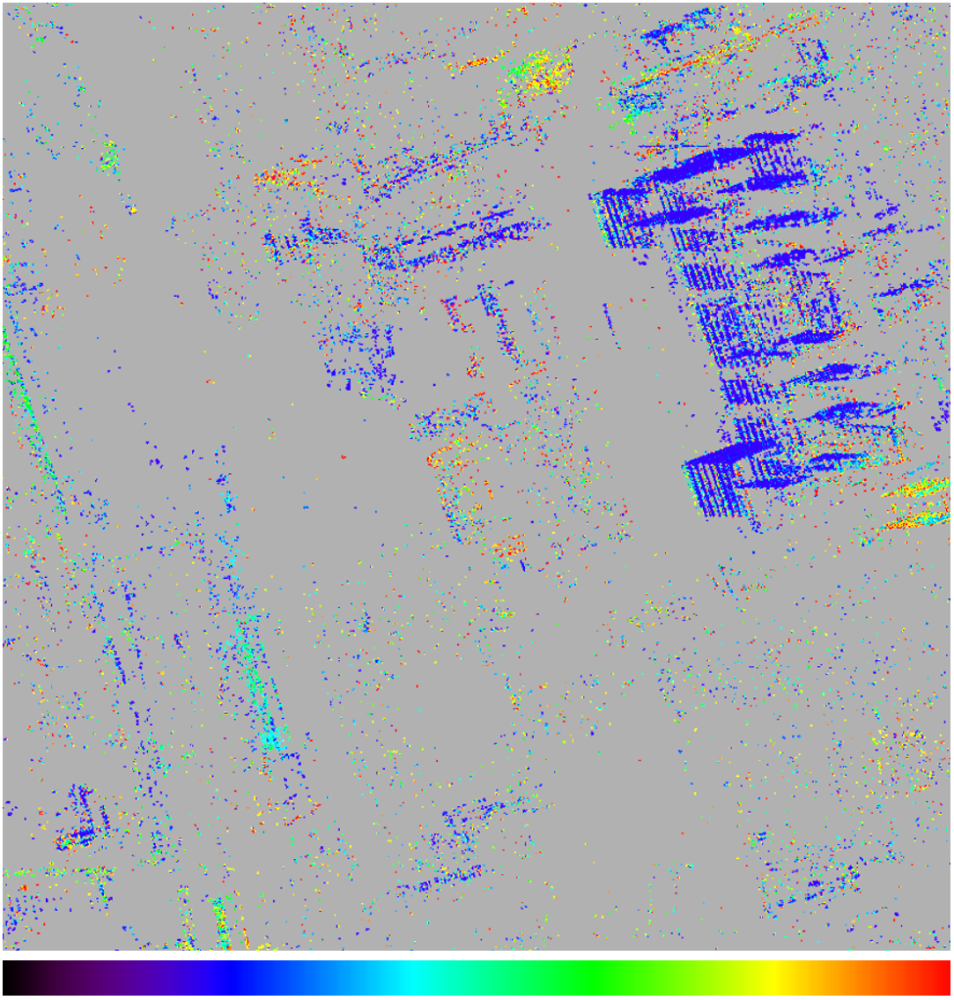
In this study, we propose 4D change detection based on PSI to detect disappearing and emerging PS points (3D) along with their occurrence times (1D). We define these two point types as disappearing big change (DBC) and emerging big change (EBC) points considering that they are subject to big changes. At first, multi-temporal SAR images are divided into several image subsets by a time series of break dates. For each pixel, the phases in the image subsets are adopted to determine its temporal coherences via a standard PSI processing. The temporal coherence reflects the phase stability and is used as an indicator of a PS point. Based on this concept, we introduce a sequence of change indices for each pixel, which are computed from its temporal coherences, to quantify its probability of being a DBC or EBC point at different times. All pixels’ change indices are used to design a global and automatic thresholding method to extract DBC and EBC points. Then, the disappearance date of each DBC is detected from the break dates based on the temporal variation in its change index sequence; the same process is also applied to each EBC point to determine its emergence date.
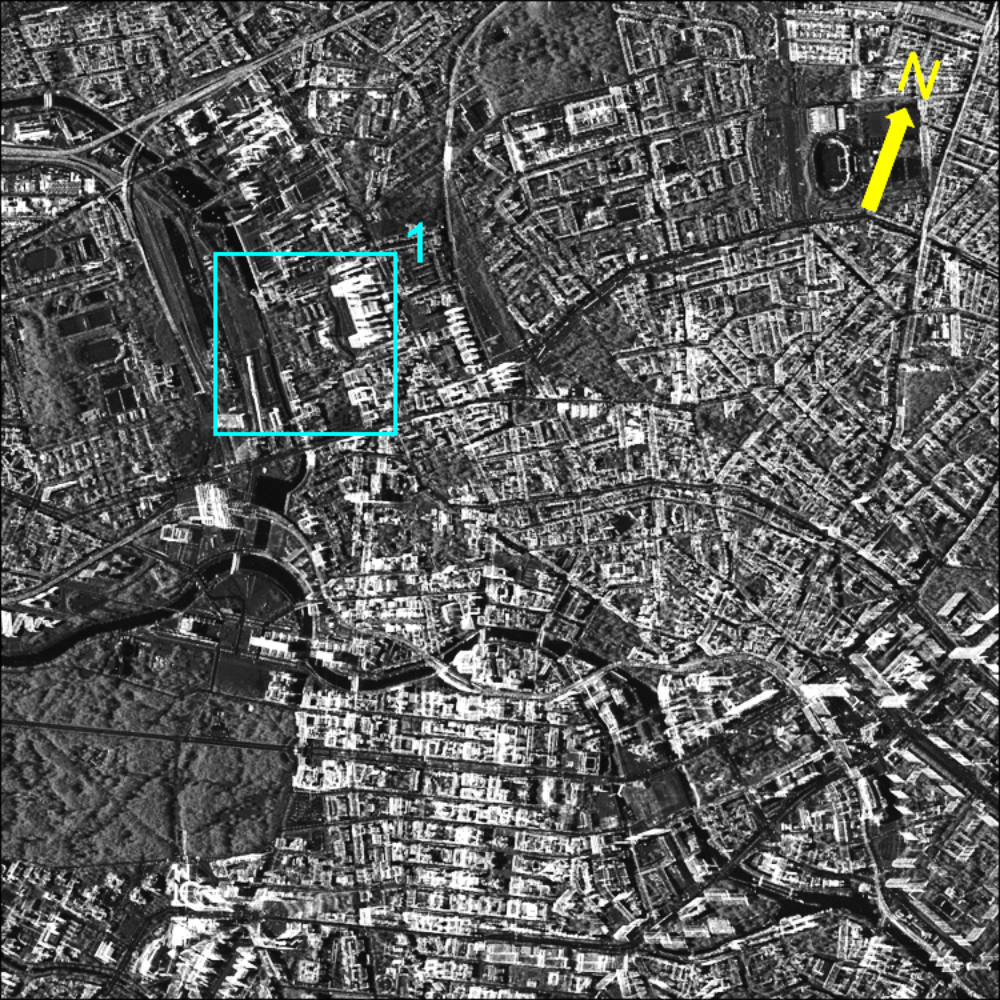
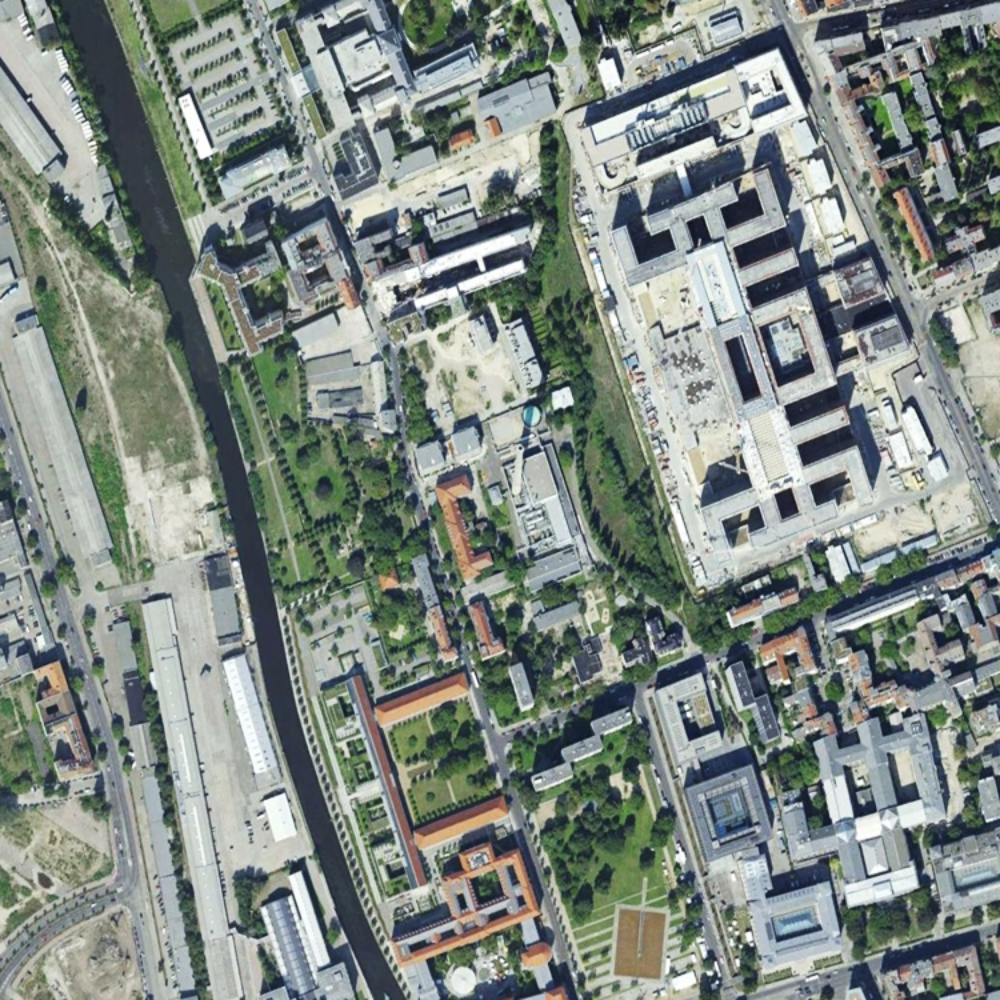
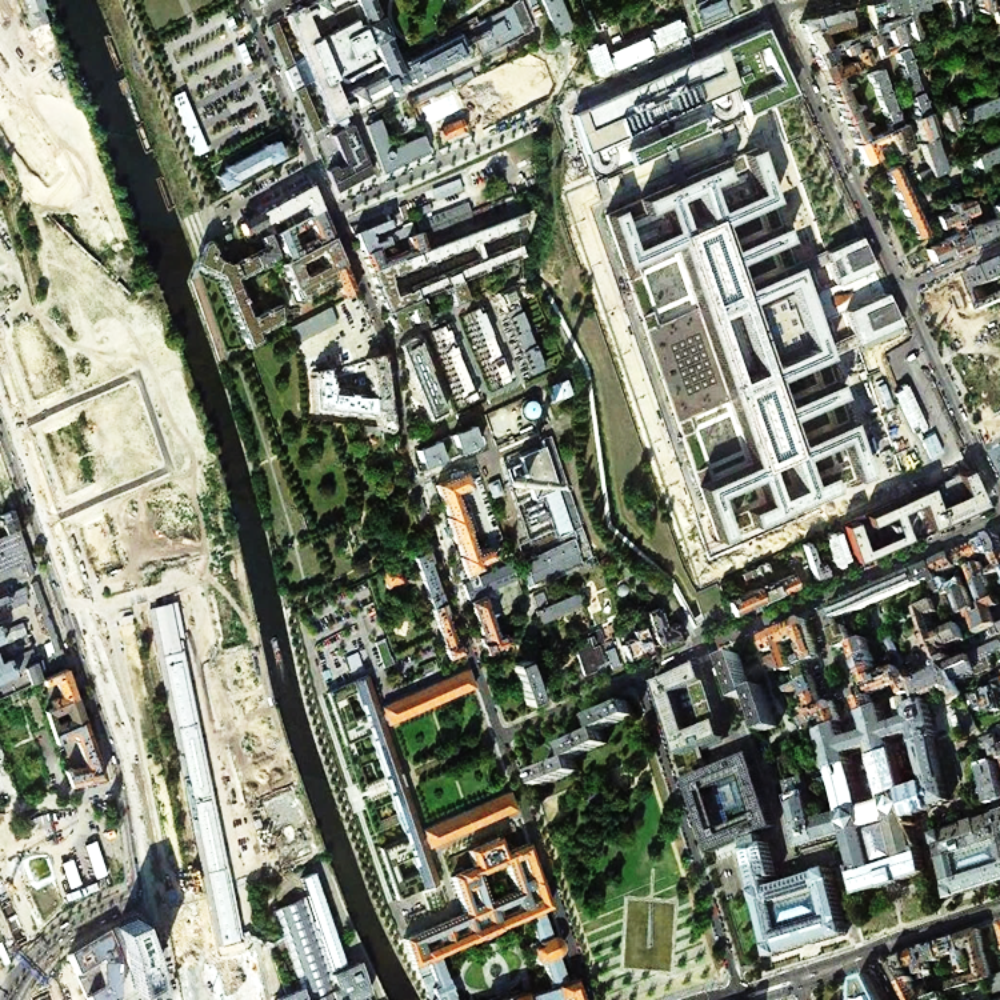
The proposed technique has been validated by the simulated and real data tests. By using a stack of TerraSAR-X (TSX) images, the real data test successfully detects the disappearing and emerging buildings in Berlin, Germany.


References
Yang, C.-H.; Kenduiywo, B. K. & Soergel, U. [2016]
Change Detection Based on Persistent Scatterer Interferometry – A New Method of Monitoring Building Changes. ISPRS Ann. Photogramm. Remote Sens. Spatial Inf. Sci., III-7, pp. 243-250.
DOI: 10.5194/isprs-annals-III-7-243-2016
Yang, C.-H.; Kenduiywo, B.K. & Soergel, U. [2016]
4D change detection based on persistent scatterer interferometry. Pattern Recogniton in Remote Sensing (PRRS), 2016 9th IAPR Workshop on Pattern Recogniton in Remote Sensing, Cancun, Mexico. 6p.
DOI: 10.1109/PRRS.2016.7867016

Uwe Sörgel
Prof. Dr.-Ing.Director of the Institute