Victor Hertel
Probabilistic Deep Learning Methods for Capturing Uncertainty in SAR-based Water Segmentation Maps
Duration: 6 months
Completition: January 2022
Supervisor: Dr. Candace Chow, Dr. Anne Schneibel, Dr. Sandro Martinis (all DLR)
Examiner: Prof. Dr.-Ing. Uwe Sörgel
Motivation
Image segmentation results have been used as a basis of map products to support near real-time emergency response to the onset of flood events. A map provides a synoptic overview of the situation and supports more targeted planning and distribution of limited resources in response to local needs. Currently, flood segmentation maps illustrate a single possible interface boundary between water and non-water classes. However, geospatial products contain inherent uncertainties from different sources, namely the aleatoric (or statistical) uncertainty, referring to the notion of randomness, and the epistemic (or systematic) uncertainty, which is caused by insufficient amount of information. Improvements to uncertainty quantification can provide additional information for informed decision-making, especially in response to non-trivial problems where wrong decisions can result in adverse consequences. Consequently, rather than returning a single possible interface boundary between classes, an area that represents the range of possible interface boundaries can be generated to visually capture the extent of segmentation uncertainty. This master’s thesis investigated probabilistic deep learning methods to capture uncertainty information associated with SAR-based water segmentation maps. For this purpose, two probabilistic convolutional neural networks, namely a variational inference-based Bayesian convolutional neural network (BCNN) and a Monte Carlo dropout network (MCDN), were extensively trained in addition to a baseline CNN for comparison.
Theoretical Background
“Traditionally, uncertainty is modelled in a probabilistic way, and indeed, in fields like statistics and machine learning, probability theory has always been perceived as the ultimate tool for uncertainty handling” (Hüllermeier & Waegeman, 2021, chap. 1). Both the aleatoric and epistemic uncertainty can be captured by learning a variational posterior distribution over the model weights, representing the uncertainty in their values, instead of single value weights. By doing so, the model turns probabilistic since the weights become random variables. Every prediction yields a slightly different result since weights are randomly drawn from the respective distribution. Bayesian inference is used to train such stochastic CNNs, which can be defined as Bayesian convolutional neural networks (BCNN). The filter values (i.e. weights) of BCNNs are defined as probability distributions that account for aggregated uncertainties.
The Monte Carlo Dropout Network (MCDN) is a neural network with random neuron dropout applied before every weight layer, such that connections to nodes are enabled (1) or disabled (0) by defining the Bernoulli distribution as the variational distribution over the network weights. Applying dropout during model training reduces generalization errors, such that the procedure regularizes the network and minimizes overfitting. When applied during both training and testing, dropout functions as an approximate Bayesian variational inference in deep Gaussian processes (Gal & Ghahramani, 2016; Kingma et al., 2015). Monte Carlo (MC) dropout works on the principle of variational inference. The aim is to minimize the cross-entropy loss function using standard optimization algorithms like stochastic gradient descent (Gal & Ghahramani, 2016; Kingma et al., 2015).
Methodology
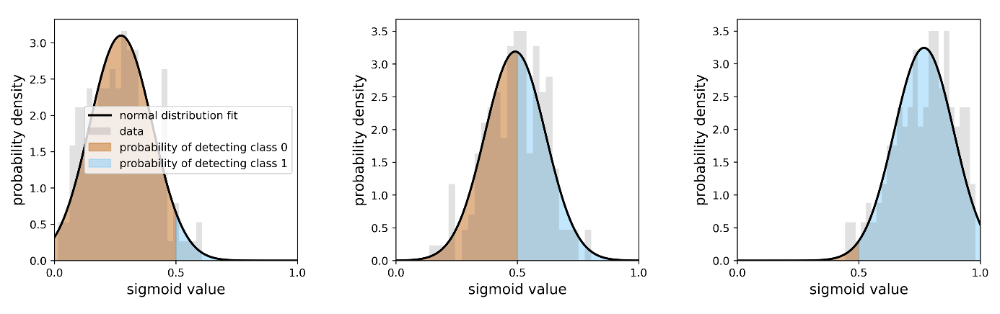
The BCNN and MCDN are probabilistic models which perform multiple forward passes to generate ensembles of sigmoid outputs. The summary of these outputs is the basis for deriving uncertainty information, which complements the segmentation map (i.e. the mean of the sigmoid outputs). In this study, model uncertainty information is derived based on the comparison of two definitions: uncertainties and probabilities of class detection. From literature (e.g. LaBonte et al. (2020)), the uncertainty of a given pixel is defined as the spread of its sigmoid values throughout multiple predictions. The spread of this distribution and thus the uncertainty can be quantified by taking the span of a confidence interval around the mean. However, this definition can be problematic as an indicator for model uncertainty since it does not consider the location of the mean itself and thus is not unambiguous. To compensate for this and to also consider the mean position as an additional criterion for model uncertainty, the definition was extended to probabilities of class detection (water, non-water). These are defined as areas under the respective probability density function, either to the left or right of the sigmoid value of 0.5. This definition returns values [0.5, 1] which can be interpreted as the probability for the segmentation to be certain. In effect, the second definition takes both the ensemble spread and the position of the mean into account when providing uncertainty information about the segmentation. Figure 1 illustrates three pixel cases, representing a random or an unclear pixel classification as well as higher likelihoods of detecting a non-water pixel and a water pixel. The derivation of uncertainty information based on the probabilities captures both the likelihood of detecting a given class and the ensemble spread.
Predictive uncertainty, as a combination of epistemic and aleatoric uncertainties, is a quantitative metric that communicates confidence in network predictions. In addition to probabilistic model architectures, the use of dedicated performance metrics that relate accuracy to certainty about predicted outputs is needed to address the objective of uncertainty quantification. Mukhoti and Gal (2018) describe uncertainty metrics for Bayesian semantic segmentation which build upon existing metrics that generally only measure the pixel accuracy. Working assumptions are such that if a model is confident about its prediction, it should be accurate on the same and if a model is inaccurate about the output, it should be uncertain about the same output. This metric is called patch accuracy versus patch uncertainty (PAvPU) and was used in addition to conventional performance metrics which evaluate the segmentation task.
Following the evaluation of the generated uncertainty information, the final part of the study demonstrates how uncertainties derived from ensemble outputs can be integrated into maps as a form of actionable information. Since the understanding of uncertainty and subsequent derivation of uncertainty information can vary across applications, a survey was designed to elicit feedback from end-users working in regional and international organizations, especially with those in emergency services and as operation coordinators.
Results and Discussion
Comparisons between the target segmentation (validation mask) with the prediction of the respective models show that while the general location of the water features is well captured, differences among the exact contours of the predicted features are observed. In average, the BCNN performance of the pure segmentation task is comparable to that achieved with the CNN and MCDN. This suggests that the generation of uncertainty information is complementary to the overarching objective of image segmentation, which is performed relatively well.
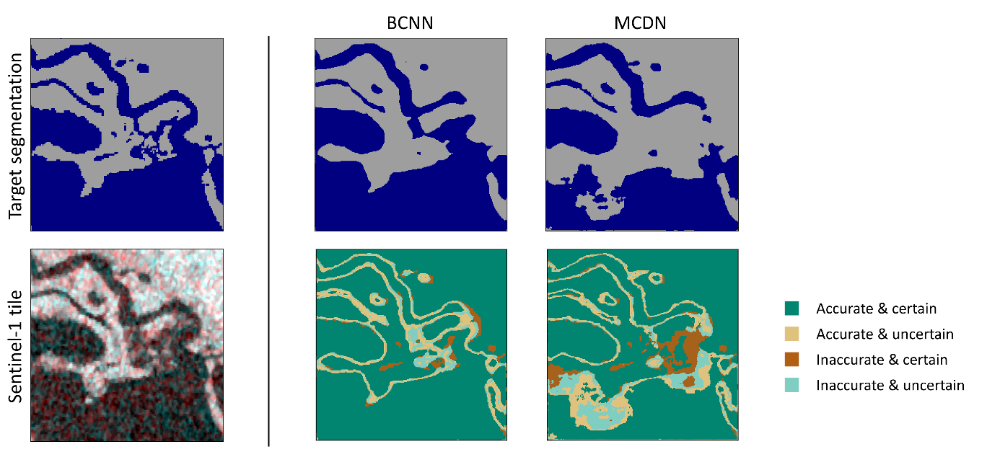
In the following, one example tile is shown to illustrate the segmentation masks as well as uncertainty masks of the probabilistic models. The tile is elevated between 128m and 138m above normal and covered by tree and broadleaf.
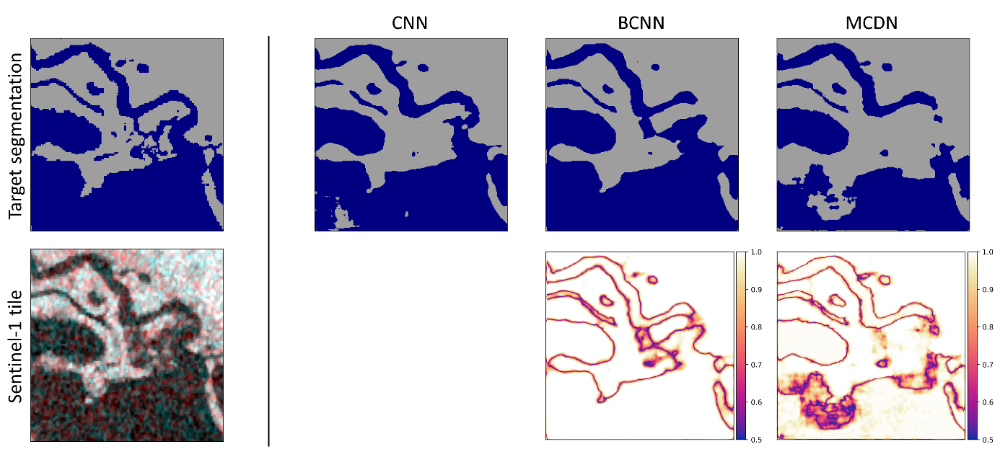
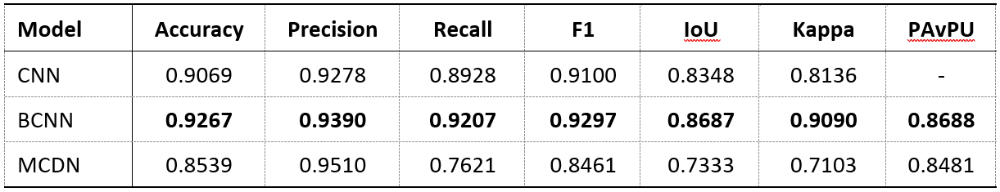
The results show that there are differences in the uncertainty information produced by BCNN and MCDN. When evaluating the accuracy and certainty of the model outputs with respect to the four cases (accurate & certain), (accurate & uncertain), (inaccurate & certain) and (inaccurate & uncertain), more details about the validity of the generated uncertainty become visible (see Figure 3). In this regard, the first and last of these cases are expected since the model should ideally predict correct results with high certainty and be uncertain about incorrect results. The PAvPU metric summarizes the relationship between accuracy and certainty in a single quantitative value that reports the proportion of the two expected cases in the complete test image, such that the presence of the two non-ideal cases in the denominator of the equation function as penalties. The results show that both models achieve PAvPU scores of the same magnitude without significant differences (see Table 2). However, PAvPU is a measure that depends on the amount of (accurate & certain) as well as (inaccurate & uncertain) cases. Due to its dual sources, PAvPU alone cannot be used to indicate better performance of one model type over the other. It should be noted that this score also varies with the definition of the accuracy and uncertainty thresholds as well as the patch size. A more extensive sensitivity analysis on how the PAvPU score varies with the calibration of these three parameter values would be useful to draw more definitive conclusions.
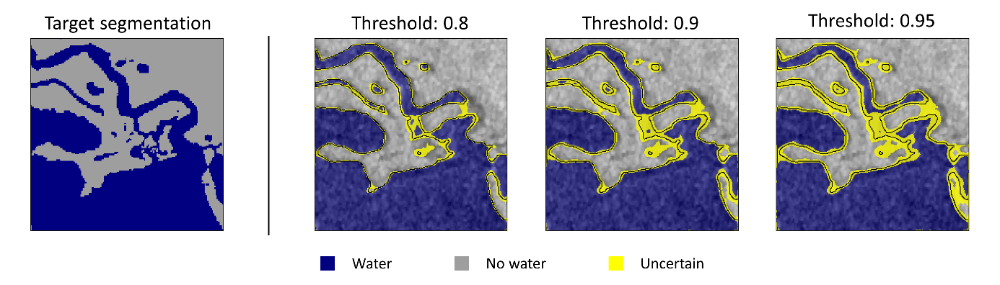
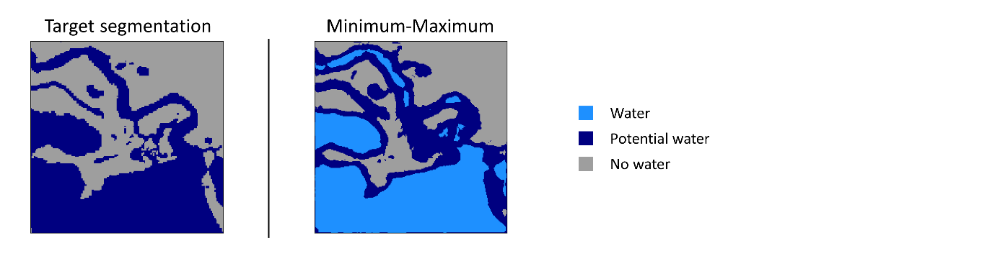
The end-user survey clearly revealed that the humanitarian community is interested in the inclusion of uncertainty information in geospatial products. Regarding uncertainty visualization, Figure 4 shows the example tile with different uncertainty thresholds, which describe probability-based uncertainty thresholds that distinguishes between certain and uncertain predictions. All pixels which do not achieve the given threshold are shown in yellow and considered uncertain. The survey revealed a median uncertainty threshold of λ = 0.9. The most preferred visualization technique is the minimum and maximum flood extent rather than uncertainty information (see Figure 5). This results from comparing the ensemble output of probabilistic models and deriving minimum and maximum segmentation results.
Conclusion
This master's thesis investigated probabilistic deep learning methods to capture uncertainty information associated with SAR-based water segmentation maps. For this purpose, two probabilistic convolutional neural networks, namely the Bayesian convolutional neural network (BCNN) and the Monte Carlo dropout network (MCDN), were extensively trained in addition to a baseline CNN for comparison. While the variational inference-based BCNN architecture supports the introduction of probability distributions over model weights, there has been relatively more widespread application of MCDN to approximate Bayesian models. This study evaluated and compared u-net-based architectures with regard to the performance of the segmentation task as well as uncertainty estimation techniques.
It was shown that both approaches can be used to obtain uncertainties in the output prediction. This approach is generally based on a stochastic process, where each probabilistic network predicts the same image multiple times. Differences in the model outputs are used to quantify the associated uncertainties. This can be done based on two definitions: i) the spread of pixelwise sigmoid distributions quantified by a confidence interval or ii) the probability of class occurrence, which takes the distribution spread as well as the location of the mean into consideration. The latter definition was used for this study due to its unambiguous class assignment.
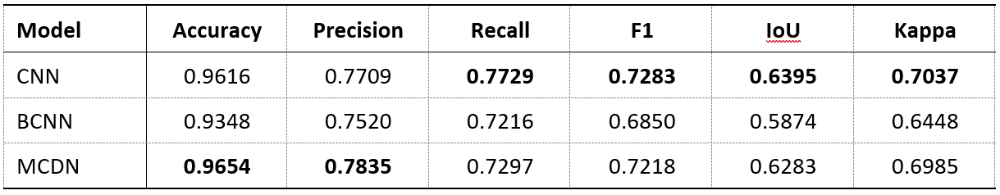
Common performance metrics (i.e. pixel accuracy, precision, recall, F1-score, IoU, Cohen's kappa) were used to assess the segmentation task of all three model architectures. While the deterministic CNN was evaluated based on a single output, the probabilistic models return multiple predictions and, thus, the mean of the ensemble outputs was used for evaluation. The results revealed that the performance of the segmentation task is comparable among the architectures, suggesting that the generation of uncertainty information is complementary to the overarching objective of image segmentation. To relate accuracy to certainty about the predicted outputs and, thus, analyse the validity of the generated uncertainty information, dedicated performance metrics such as PAvPU were used. These metrics rely on a domain- and user-specific uncertainty threshold and a respective pixelwise classification into (accurate & certain), (accurate & uncertain), (inaccurate & certain) and (inaccurate & uncertain). The results showed that differences exist in the extent and the manner in which both probabilistic models generate uncertainty. This was shown on a pixel- as well as an image-based level. While the PAvPU scores of both models were of the same magnitude without significant differences, the MCDN generally captured more (inaccurate & certain) cases, which indicate model overconfidence since the segmentation is inaccurate. This specifically applies to the target water class and is an indication of a potential advantage of the BCNN over the MCDN. However, since uncertainty quantification is a non-trivial process, the comparison of the uncertainty generated by BCNN and MCDN cannot rely on one metric only. This study considered a few different perspectives and presented quantitative and qualitative metrics, which all indicated that BCNN might capture more uncertainty-related information. More definitive conclusions can only be drawn by conducting more targeted analyses.
Following the evaluation of the generated uncertainty information, the final part of the study demonstrated how uncertainty information can be integrated into geospatial products to support humanitarian operations. A survey was prepared and distributed to governmental authorities, NGOs and organizations of the United Nations. This survey clearly revealed that the humanitarian community is interested in the inclusion of uncertainty information in map products. It was suggested to add the uncertainty as an additional and optional layer of information and to distribute it specifically to trained coordinators. This promotes more responsible use of the provided information while ensuring that maps for acting operators are as simple to use as possible. The survey also returned uncertainty thresholds for the context of flood hazards, which were used to obtain the results in this study.
References
Gal, Y., & Ghahramani, Z. (2016). Dropout as a Bayesian approximation: Representing model uncertainty in deep learning. 33rd International Conference on Machine Learning, ICML 2016, 3.
Hüllermeier, E., & Waegeman, W. (2021). Aleatoric and epistemic uncertainty in machine learning: an introduction to concepts and methods. Machine Learning, 110(3). https://doi.org/10.1007/s10994-021-05946-3
Kingma, D. P., Salimans, T., & Welling, M. (2015). Variational dropout and the local reparameterization trick. Advances in Neural Information Processing Systems, 2015-January.
LaBonte, T., Martinez, C., & Roberts, S. A. (2020). We Know Where We Don’t Know: 3D Bayesian CNNs for Credible Geometric Uncertainty.
Mukhoti, J., & Gal, Y. (2018). Evaluating Bayesian Deep Learning Methods for Semantic Segmentation. CoRR, abs/1811.12709. http://arxiv.org/abs/1811.12709
Olson, D. M., Dinerstein, E., Wikramanayake, E. D., Burgess, N. D., Powell, G. V. N., Underwood, E. C., D’amico, J. A., Itoua, I., Strand, H. E., Morrison, J. C., et al. (2001). Terrestrial Ecoregions of the World: A New Map of Life on Earth: A new global map of terrestrial ecoregions provides an innovative tool for conserving biodiversity. BioScience, 51 (11).
Wieland, M., & Martinis, S. (2019). A modular processing chain for automated flood monitoring from multi-spectral satellite data. Remote Sensing, 11 (19). https://doi.org/10.3390/rs11192330
Ansprechpartner

Uwe Sörgel
Prof. Dr.-Ing.Institutsleiter, Fachstudienberater