Shu Suo
Semantic Segmentation with Remote Sensing Data and Reference Labels Based on Simulation Methods
Duration of the Thesis: 6 months
Completion: July 2020
Supervisor: Dr. Stefan Auer (DLR)
Examiner: Prof. Dr.-Ing. Uwe Sörgel
The amount of remote sensing data has greatly increased with the development of satellites and sensors. A fundamental task in remote sensing is the interpretation of imagery. This task could be done with semantic segmentation methods.
There are some benchmark datasets for remote sensing, like ISPRS benchmark dataset of Potsdam. However, the samples in training dataset influences the result of the neural network, while buildings and nature sceneries vary greatly in different areas. Optical imagery is usually manually labelled but it is not likely to do that for each specific area. Meanwhile, it is very challenging to manually label SAR imagery. Hence, an automatic process to generate reference labels would facilitate the application of remote sensing data in convolutional neural network (CNN) training.
To solve those problem, in this thesis, SimGeoI[2] is used to generate “ground truth” automatically with DSM used as input data. Batch processing of SimGeoI marks label of pixel for either optical image or SAR data. This framework takes geometry of objects into consideration, which is important for high resolution satellite images.
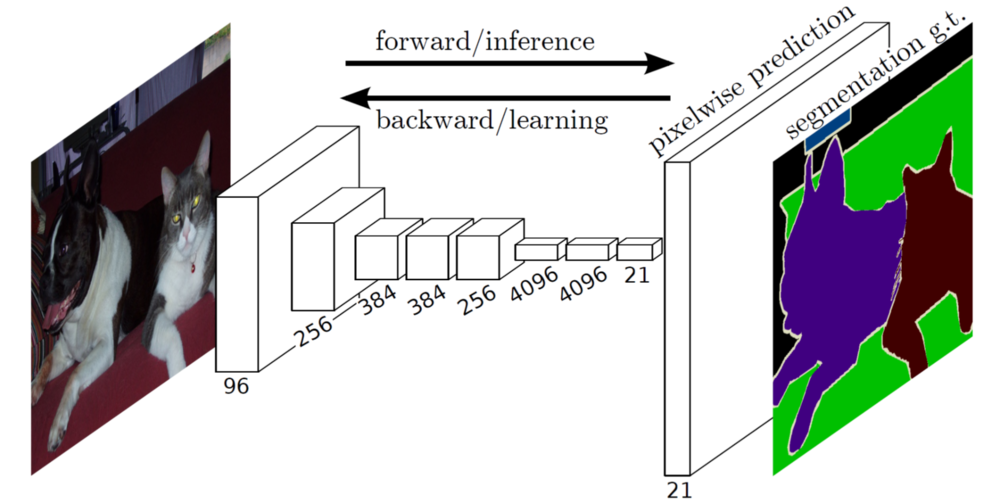
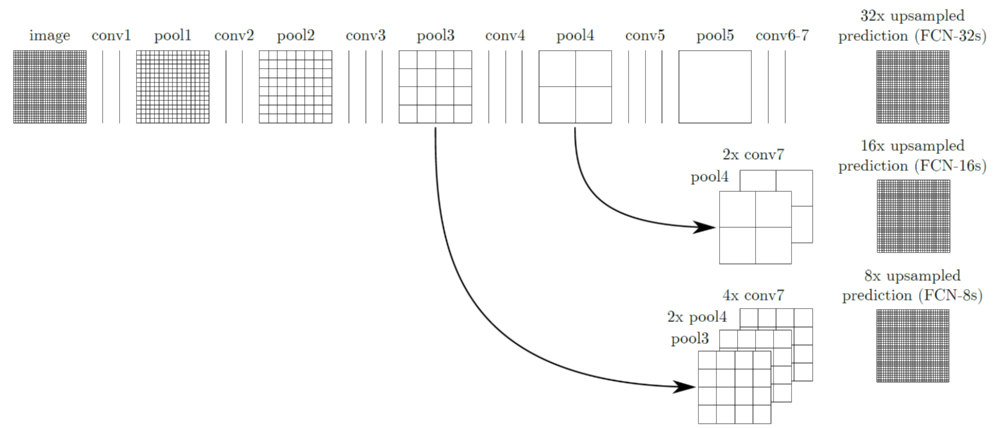
To investigate that these generated labels could be used in semantic segmentation, case studies for both optical and SAR data are given. FCN-8s based on VGG16 is chosen in this thesis, which is a classic segmentation method. The batch processing of SimGeoI as well as the tool to automatically process and organize output data from SimGeoI and input of neural network are implemented.
The data used here are multispectral images from WorldView2 and SAR intensity images from TerraSAR-X for the area of Munich. Example of images, generated labels and test results for both optical and SAR data are given.
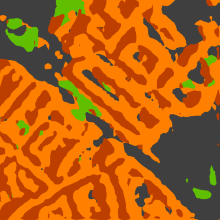
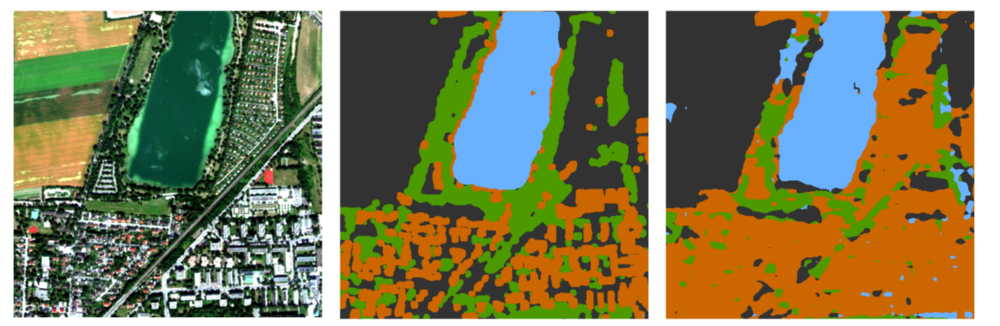
An example of optical image is shown in Figure 3. The corresponding reference label image is shown in Figure 4. The test result is shown in Figure 5. In reference labels and test result images, orange indicates building, blue means water, green indicates vegetation and dark grey means ground.
An example of SAR image is shown in Figure 6. The generated SAR image label image is shown in Figure 7. The test result is shown in Figure 8. In reference labels and test result images, orange indicates building, brown means shadow, green indicates vegetation and dark grey means ground.

Reference
-
[1] Long, E. Shelhamer, and T. Darrell. Fully Convolutional Networks for Semantic Segmentation. Mar 2015. [2] Stefan Auer, Isabel Hornig, Michael Schmitt. Simulation-Based Interpretation and Alignment of High-Resolution Optical and SAR Images. Nov 2017.
Ansprechpartner

Uwe Sörgel
Prof. Dr.-Ing.Institutsleiter, Fachstudienberater