Javkhlan Batbayar
Integration of multiple collected polygons with a raster-based approach
Duration of the Thesis: 6 months
Completion: August 2019
Supervisor: Dr.-Ing. Volker Walter
Examiner: Prof. Dr.-Ing. Uwe Sörgel
Introduction
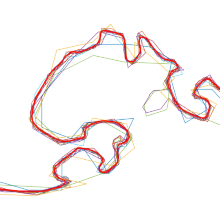
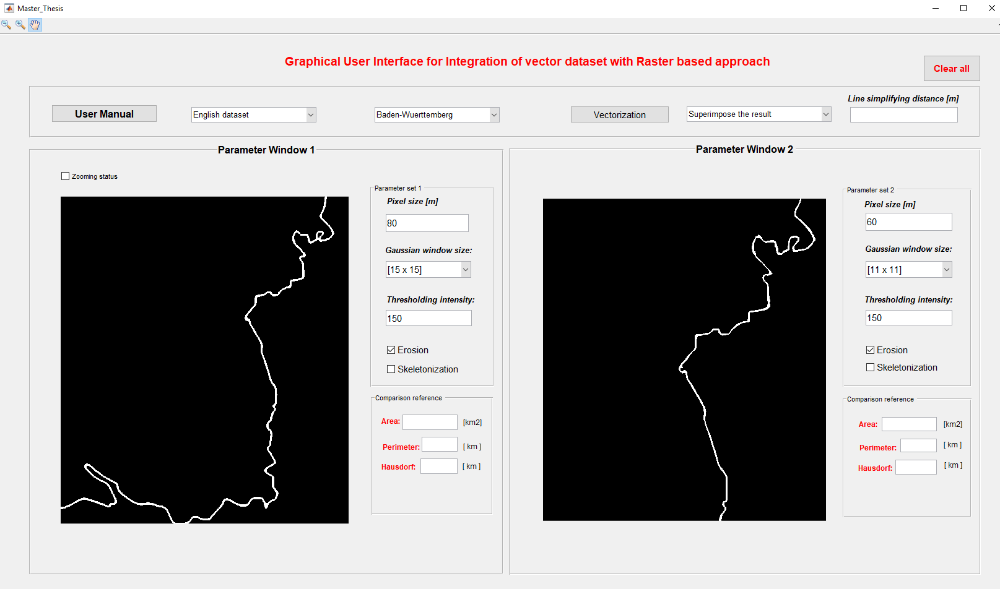
The main goal of the master project is integrate multiple collected polygon using raster based approach and design GUI (graphical user interface). Students who are taking Geoinformation module provided the raw shapefiles. The source map is shown in the Figure 1. Graphical user interface designed to adjusts the image processing parameters, wherefore it assist to improve end user experience. These parameters are raster cell size, the Gaussian filter window size, thresholding grey value and line simplification buffer distance. GUI provides certain possibilities such as compare integrated polygons with reference polygon, provide quality analysis (differences of area, perimeter, and Hausdorff between reference data and integrated polygon), and superimpose integrated polygon on the initial raw shape file to visually inspect the quality dependencies of integrated polygon and raw shapefile.
Methodology
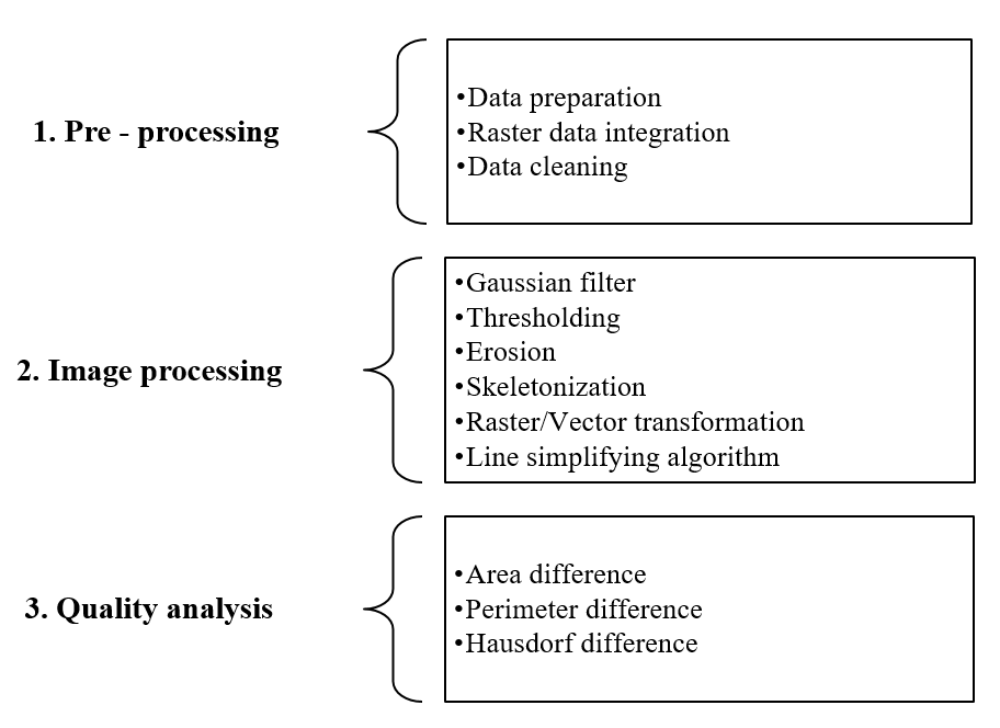
The entire process chain have partitioned into three stages. Pre-processing, Image processing and Quality analysis. Each stages has a sub tasks that are listed in Figure 2 by the loading order. In other words, sub tasks are the intermediate steps that are going to be performed by GUI (Graphical User Interface).
In the pre-processing stage, initial vector data is sorted by state, and converted into raster data with rasterization algorithm. There are several problems occurred after application of rasterization algorithm which is marked as 1, 2, 3 in Figure 1. More than half of students did not digitize small islands where others are digitized the small islands. These islands are removed semi automatically using QGIS.
Image processing method on the other hand able to remove the heterogeneous data quality, which is not repeated by many students. Gaussian filter is used to smooth the high frequency structures and thresholding operation converted grey scale image into binary image with selected intensity value. Afterwards, morphological operation such as erosion (remove the pixels with less than 4- connection), image opening operation (fills the pixel value (0) that are surrounded by 8-connected pixel value (1)) and skeletonization (thin lining operation by checking 8-pixel connectivity). The result from skeletonized image is transformed using vectorization algorithm to obtain integrated polygon. At last, integrated polygon is simplified using Douglas Peucker’s algorithm.
Results
The result of the thesis is integrated polygon (vector domain), and the its quality analysis operating with GUI. The optimal result is depending on chosen parameter set by user. In order to maintain the level of user friendliness, general parameter sets are defined to provide user manual to the GUI. These parameter sets are not necessarily optimal best version. However, it is guiding the users to obtain their own set of parameters, which are optimal. RC (raster cell size), GF (Gaussian filter window size), TH (Thresholding grey value).
- Parameter set 1: RC:80, GF:[15x15] TH:150
- Parameter set 2: RC:100, GF:[11x11] TH:150
- Parameter set 3: RC:150, GF:[7x7] TH:120
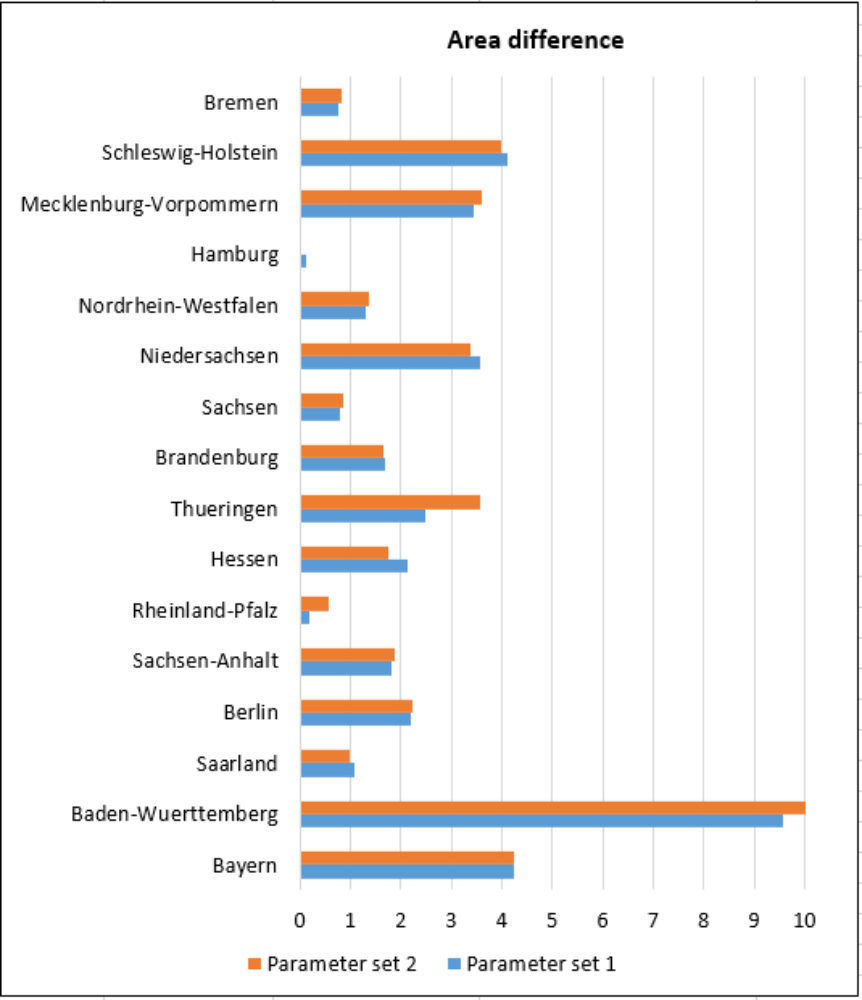
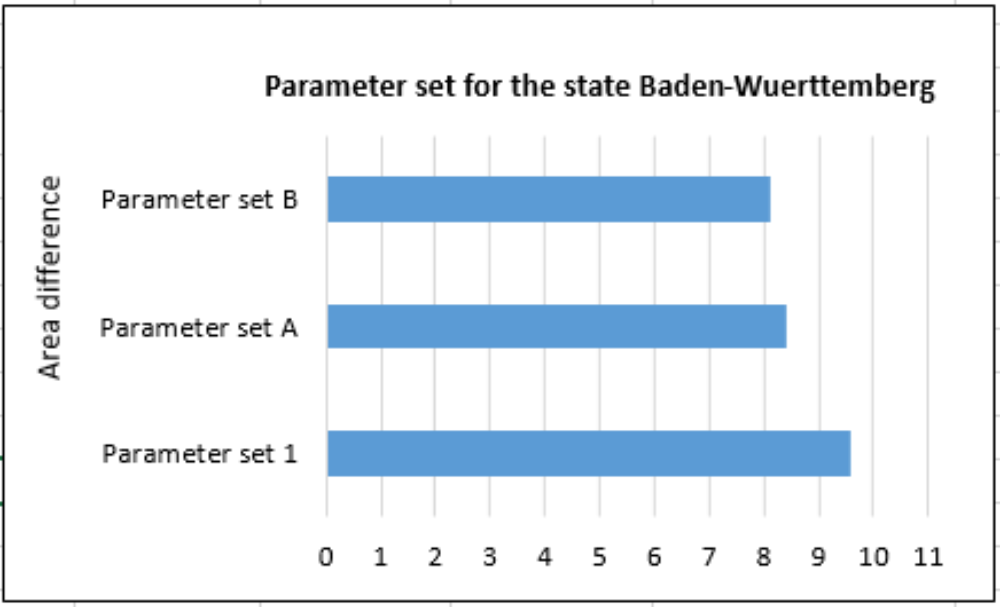
The quality analysis are computed on the pre-defined parameter sets. In Figure 3, parameter set 1 and parameter set 2 are compared regarding area difference between reference data (vector domain) and the integrated polygon. The highest area difference occurred in the state Baden-Wuerttemberg. This can be caused by the larger raster cell size (80 m; 100 m) which washed away part of the data during image processing tasks.
As discussed in the previous section, pre-defined parameter sets are not necessarily optimal, where user have control over parameter adjustment. In order to improve the area difference, the user needs to decrease the raster cell size (lower than parameter set 1). I compensated the parameters once again to improve the area difference occurred in the state Baden-Wuerttemberg. As you can see from Figure 4, the larger raster cell in parameter window 1 combined with higher Gaussian filter washed away the part of the integrated raster data. However in parameter window 2, decreasing raster cell size maintained the level of detain in the integrated raster data.
In Figure 5 is comparing area differences in the cases of 80 m (parameter set 1) and 60 m (parameter set B). Parameter set B (RC:60, GF:[11x11], TH: 150) is decreased the area difference than parameter set 1, although area difference is still considered as high 8 comparing to the states in Figure 3.
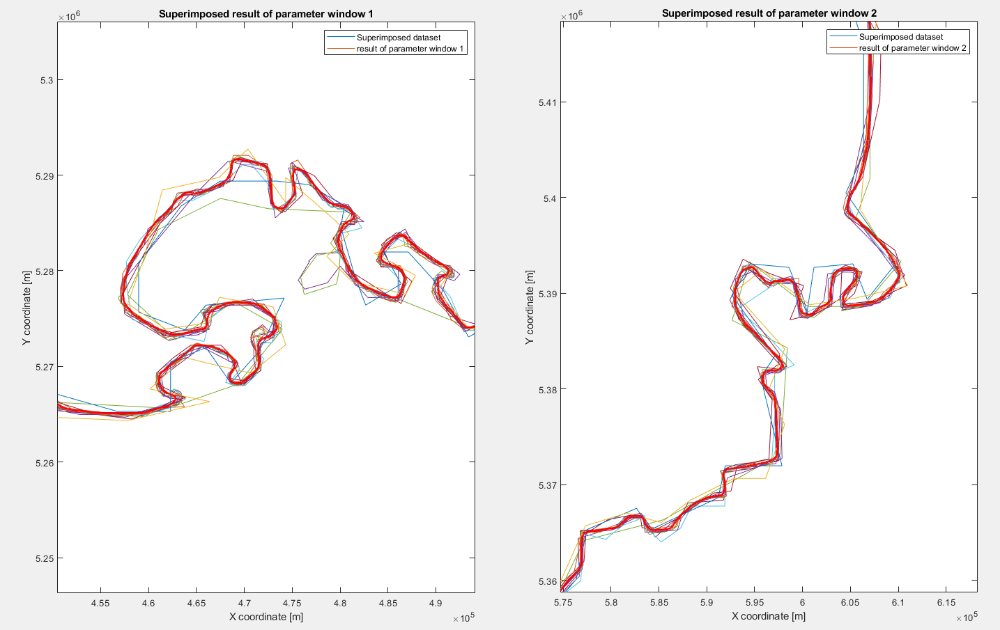
On the one hand GUI allocate users not only statistically compare but the visually question heterogeneous quality of the initial raw data and its dependencies in the integrated polygon. Figure 6 is revealing the integrated polygon (red) is superimposed on initial raw data (multiple color). In parameter window 1, some part did not covered by students and therefore excluded, which can also be the reason for the higher area difference occurring in the state Baden-Wuerttemberg.
Conclusions
- The initial data quality has direct influence to the end data quality. Rasterization algorithm was able to detect noticeable misleading nodes contained in the raw shapefiles. The unqualified data (mostly because of extra digitized island) that were repeated by many have been removed semi-automatically. Cleaning the initial data indeed assisted to successfully integrate sorted raster data. On the other hand, graphical user interface is helpful for visual inspection. By compensating parameters (Gaussian window size, theresholding value and raster cell size), the redundancies that are not repeated by many students were removed.
- GUI is effective means of visually and statistically comparing the trends and of compensating the parameters.
- Predefined parameter sets are used to guide the users in the GUI. For example: there exist minimum and maximum limits for pixel size, thresholding grey value, and line simplifying buffer distance. Exceeding default number will throw MatLab modal error message. GUI has designed specially to improve user friendliness.
- Superimposing integrated polygon with raw sorted shapefile enabled users to question initial data quality so that user can easily distinguish if the problem is from the side of parameter compensation or initial data quality.
- The heterogeneous quality of the data, that was not repeated by many students, can be eliminated
- After application of Douglas Peucker line simplification algorithm, data volume has decreased approximately 90%. However, the quality of integrated polygon is slightly decreased with increasing buffer distance.
Future Work
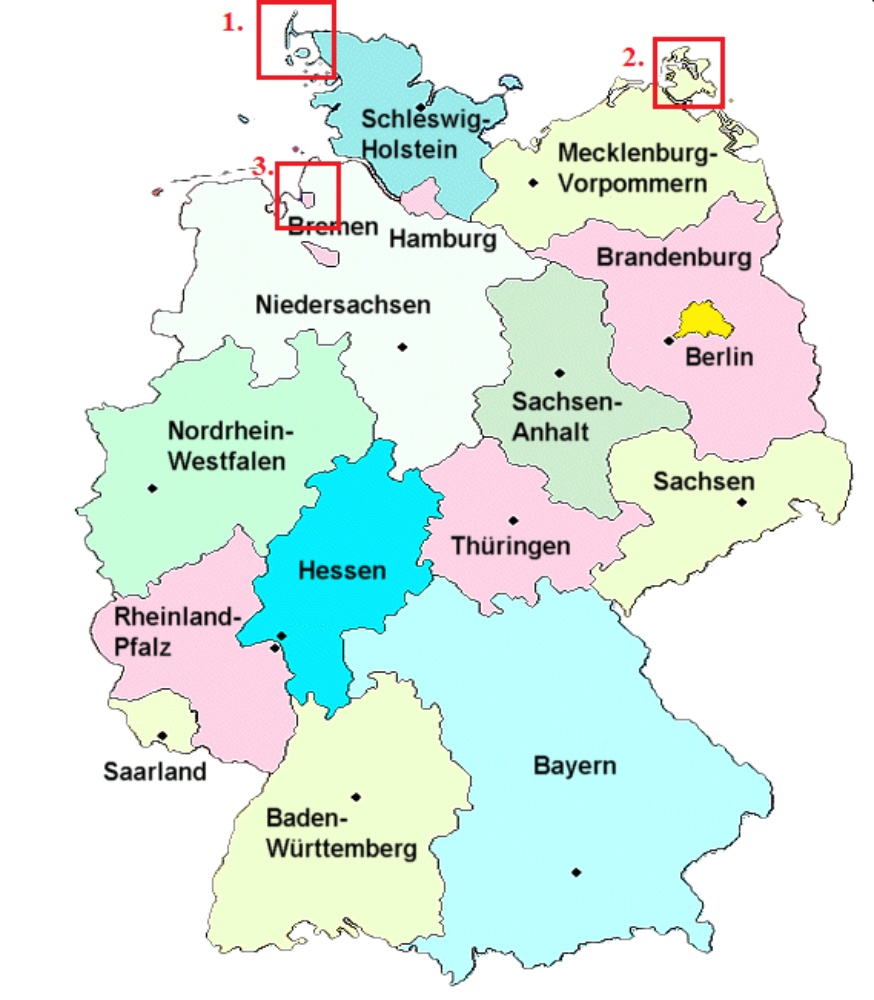
- Successful process chain will depend on the initial data quality. One of the main factors to increase initial data quality is clear guidance towards the digitization task. Choice should not be left to the students, which islands to digitize and which islands not to digitize. There must be consistency among all students. The digitization of small islands of the sates Schleswig-Holstein, Mecklenburg-Vorpommern, and Bremen are an example of where there has been a lack of needed consistency.
- MatLab GUIDE is migrating to GUIDE application. GUI can be developed in this new application. The new application has advantages such as an enhanced UI component set, design environment, a robust programming editor and workflow, and the ability to create and share a standalone desktop or web app.
- Data preparation and data sorting sub tasks should be performed automatically. However, the spelling mistakes inside the collected initial data require major effort to correct the mistakes. Linguistic algorithm can be developed for this purpose.
References
Bernhardsen, T. (2002), Geographic information systems: an introduction, John Wiley & Sons.
Chen, H. and Walter, V. (2009), Quality inspection and quality improvement of large spatial datasets, in ‘Proceedings of the GSDI 11 World Conference: Spatial Data Infrastructure Convergence: Building SDI Bridges to Address Global Challenges’.
Goodchild, M.F. (2007), ‘Citizens as sensors: the world of volunteered geography’, GeoJournal 69(4), 211–221. URL: https://doi.org/10.1007/s10708-007-9111-y
Goodchild, M. F. and Glennon, J. A. (2010), ‘Crowdsourcing geographic information for disaster response: a research frontier’, International Journal of Digital Earth 3(3), 231–241.
URL: https://doi.org/10.1080/17538941003759255
Hossain, M. (2012), ‘Crowdsourcing: Activities, incentives and users’ motivations to participate’, ICIMTR 2012 - 2012 International Conference on Innovation, Management and Technology Research.
Jang, S.-G. and Kim, T. J. (2007), Semantically interoperable geospatial information processing: A review and a canonical model approach, in ‘proceedings of the 10th AGILE International Conference on Geographic Information Science. Aalborg, Denmark’.
Monika Sester, Jamal Jokar Arsanjani, R. K. D. B. J.-h. H. (2013), ‘Chapter 5 integrating and generalizing volunteered geographic information’
Saalfeld,A.(1988),‘Conflation automated map compilation’, International Journal of Geographical Information Systems 2(3), 217–228.
URL: https://doi.org/10.1080/02693798808927897
Sehgal, V., Getoor, L. and Viechnicki, P. D. (2006), Entity resolution in geospatial data integration, in ‘Proceedings of the 14th annual ACM international symposium on Advances in geographic information systems’, ACM, pp. 83–90.
Senaratne, H., Mobasheri, A., Ali, A. L., Capineri, C. and Haklay, M. M. (2017), ‘A review of volunteered geographic information quality assessment methods’, International Journal of Geographical Information Science 31(1), 139–167.
URL: https://www.tandfonline.com/doi/full/10.1080/13658816.2016.1189556
Solomon, C. and Breckon, T.(2011), Fundamentals of Digital Image Processing: A practical approach with examples in Matlab, John Wiley & Sons.
Toussaint, G. (1988), ‘Grids, connectivity, and contour-tracing’, URL:http://wwwcgrl.cs.mcgill.ca/god fried/teaching/pr-notes/contour. ps.
Vandecasteele, A. and Devillers, R. (2013), Improving volunteered geographic data quality using semantic similarity measurements, Vol. XL-2/W1.
URL:https://www.int-arch-photogramm-remote-sens-spatial-inf-sci.net/XL-2-W1/143/2013/
Verma, R. and Ali, J.(2013), ‘A comparative study of various types of image noise and efficient noise removal techniques’ ,International Journal of advanced research in computer science and software engineering 3(10).
Ansprechpartner

Volker Walter
Dr.-Ing.Gruppenleiter Geoinformatik