Refat Ayyad
Comparison of Persistent Scatterer Interferometry Results using TerraSAR-X and Sentinel-1 Images
Duration of the Thesis: 6 months
Completion: August 2018
Supervisor: M.Sc. Chia-Hsiang Yang
Supervisor & Examiner: Prof. Dr.-Ing. Uwe Sörgel
Introduction
Monitoring of constructions and buildings has significantly been increased for several years. Detection of surface changes (deformations) that happen to the constructions during long time periods, has become a common activity of remote sensing experts and companies. This thesis deals with monitoring technique that belongs to InSAR, called Persistent Scatterer Interferometry “PSI” to analyze ground deformations of Hessigheim area, Germany that also includes Hessigheim Lock Complex Structure, that’s located in Neckar River. The nature of the ground there has led to significant deformations, and that caused high and costly reconstruction work and repairs. Depending on a consecutive TerraSAR-X and Sentinel-1 images, PSI has been applied to determine subsidence and displacement patterns in Hessigheim over the period between November 2014 to May 2017.
Comparison between TerraSAR-X and Sentinel-1 images is important to see the difference between non-open costly source (TerraSAR-X) and open-source (Sentinel-1) images. The only and first institute, which made a comparison was in 2016 by Remote Sensing Technology Institute in German Aerospace Center (DLR), Bremen, Germany. They could compare between those two sources of data only in the framework of maritime targets detection. So that in this thesis, the first comparison between our two sources of data (sentinel-1 and TerraSAR-X) will be performed in the framework of time series displacements, depending on PSI method. One ground control point (GCP) with zero velocity deformation was generated to precisely compare TerraSAR-X and Sentinel-1 processing’s results.
The comparison is helpful for engineers or the companies if they want to monitor an area or use data in application, because they will be able to choose between costly source (TerraSAR-X) and free source (sentinel-1) to achieve their purpose.
Methodology
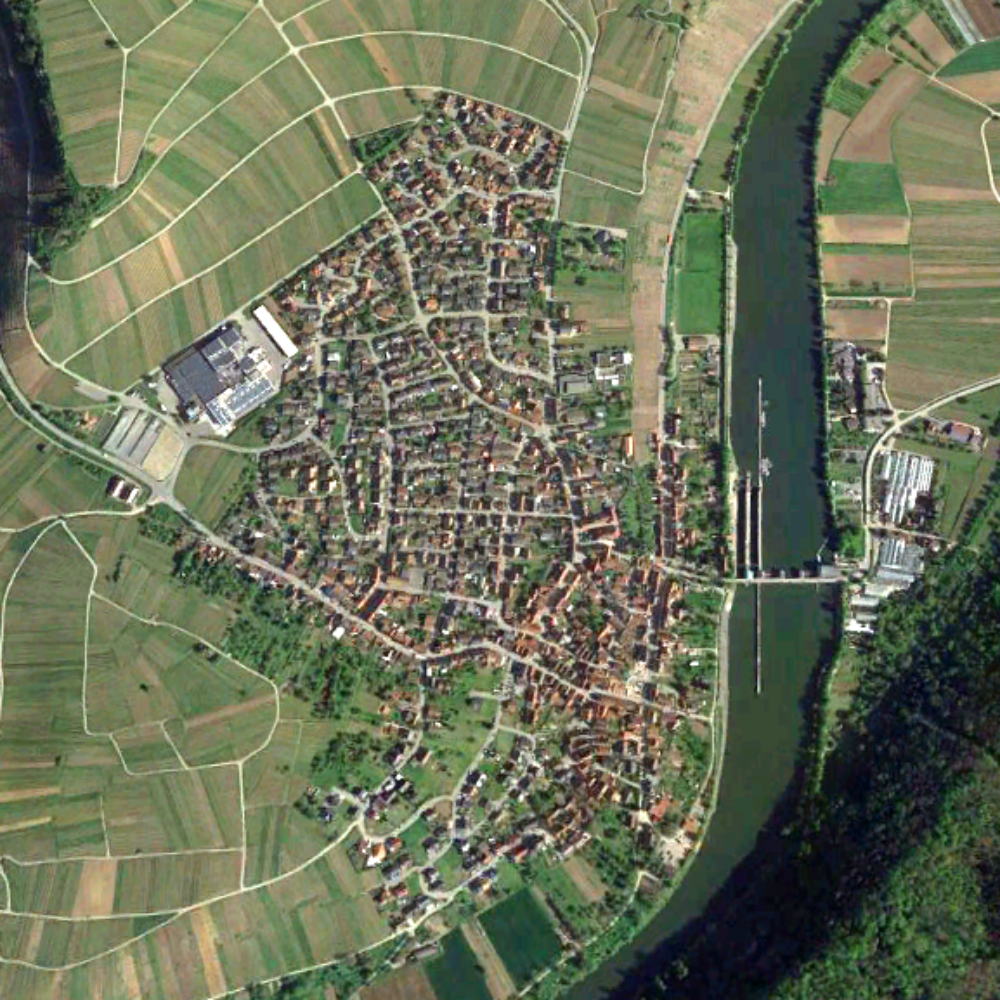
A) Area of Interest
The area of interest of this research is Hessigheim town which is located in the state of Baden Württemberg (BW), 25 km north of Stuttgart city (the capital of BW state). The area is a small town surrounded by river, farms, fields and some urban areas.
B) Persistent Scatterer Interferometry
Persistent Scatterer Interferometry (PSI) technique has become popular remote sensing tool for assessment the earth surface and deformations that happen by the time. The essence of PSI method is using multiple of SAR images that are taken from the satellite with same relative orbit for a specific piece of land. The main result of this method is providing a detailed view of surface behavior during specific period of time. The deformations are estimated in direction of line of sight (LOS).
The main principle of PSI is to derive φdisp (displacement phase component) from total phase
C) Comparison Methods
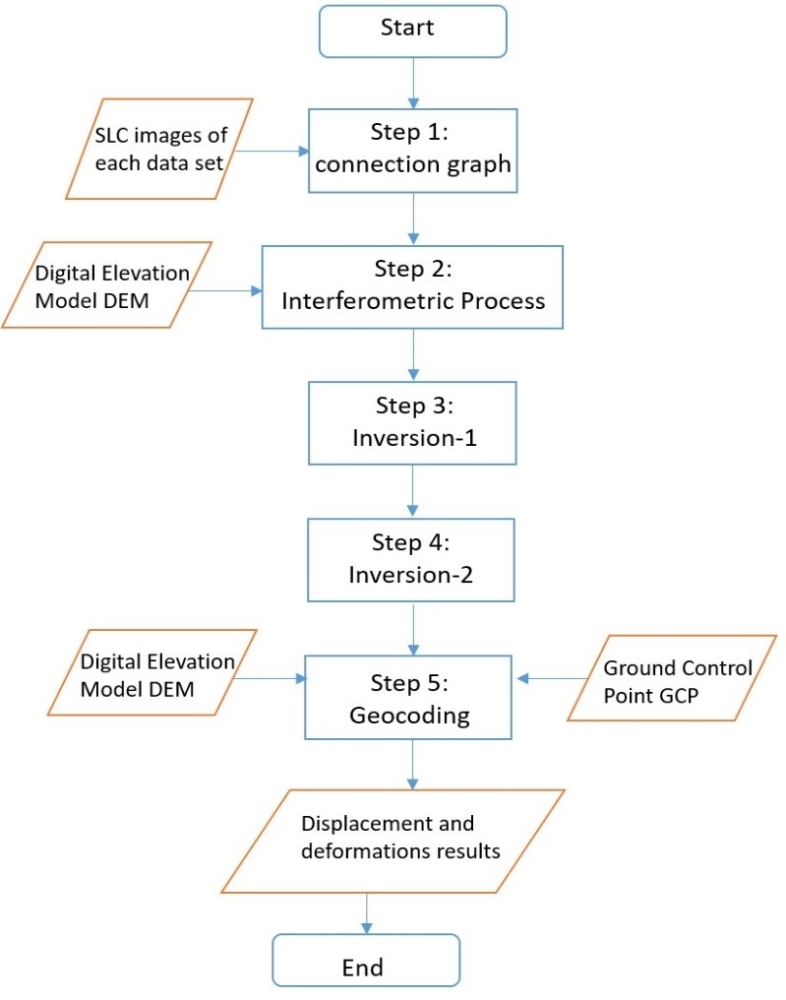
Once datasets are prepared and processed by PSI technique, we can make the comparison between two sources by three methods:
- Density of PS points that are produced from processing each dataset (TerraSAR-X descending, sentinel-1 descending and sentinel-1 ascending). Processing of TerraSAR-X images produces much more PS points than sentienl-1 even if the number of sentinel-1’s images more than TerraSAR-X.
- Deformation results of each dataset. The results will be in direction of line of sight (LOS).
- Overall quality of results from each dataset. TerraSAR-X results should produce better results with less noise than sentinel-1. The main reason is that TerraSAR-X uses short X-Band arrays sensor technique that provides a high sensitivity to smaller surfaces movements and extra precision of results.
Results
First: PS points density from each dataset:
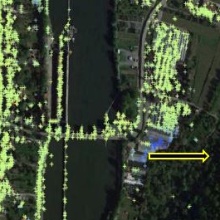
- The following figure (figure 3) shows persistent scatterers distributions resulted from each dataset. PS points resulted from TerraSAR-X data are much more than PS points resulted from sentinel-1 data both ascending and descending. Around half million PS points resulted from TerraSAR-X, whereas around 27930 and 23665 PS points resulted from sentinel-1 data ascending and descending respectively.

- Regarding to the bridge above Neckar River, it is totally covered by TerraSAR-X data. Whereas small part around right-side of the bridge is covered by sentinel-1 descending data, and small part of left-side of the bridge is covered by sentinel-1 ascending.
- In addition to that, there are many areas have been recognized by TerraSAR-X and have not been recognized by sentinel-1. TerraSAR-X could acquire features more than sentinel-1.
Second: Deformation Analysis and Overall Quality of results:
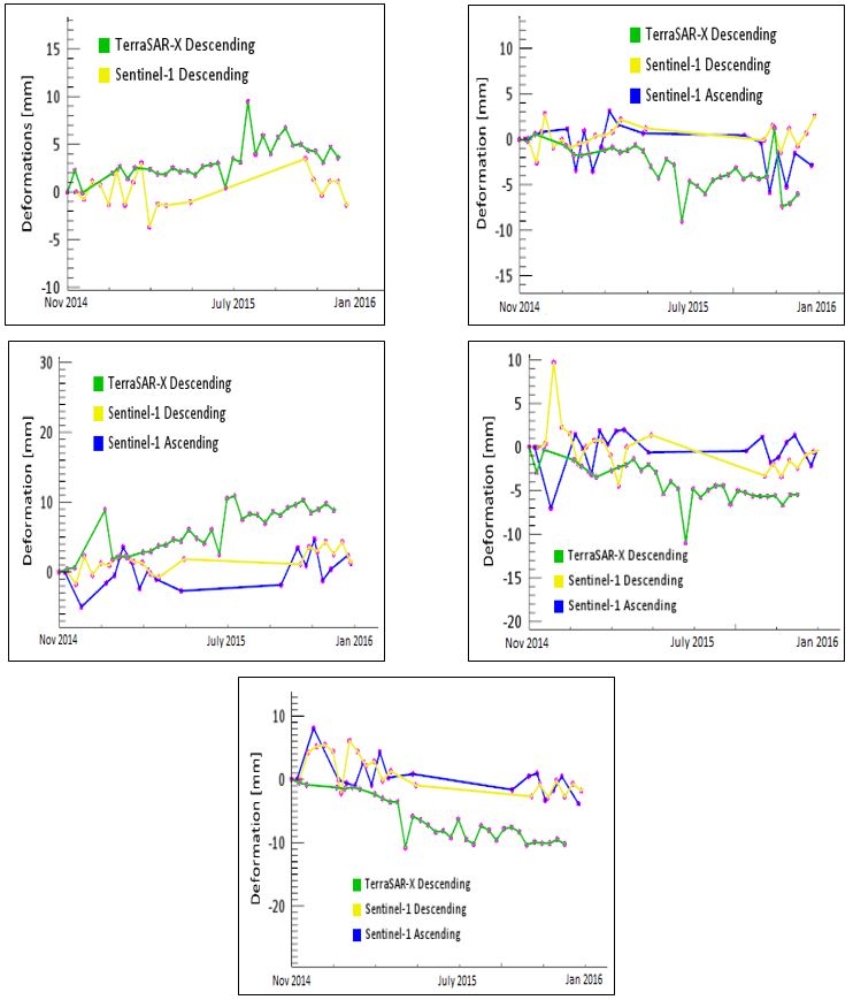
There are significant differences between three datasets according to the deformation values. In the following figure (as example), the difference between three datasets is clear.
It shows time series deformation analysis for the point, that’s located in (48°59'34.01"N, 9°11'39.02"E) to the south-east of the bridge:

As you can you see from figure 4, three datasets show that the point deformed by the time. But TerraSAR-X shows more deformation values than sentinel-1. TerraSAR-X descending shows maximum deformation value of around -16 [mm] in end of December 2015, whereas sentinel-1 descending shows that the point had maximum deformation of -7 [mm]. Sentinel-1 data shows that the point has little deformation in ascending direction compared with descending direction.
In addition to that, the following figures also show the difference between Sentinel-1 and TerraSAR-X in the framework of deformation analysis. The results are for some points distributed in different areas in Hessigheim:
Conclusions
The method for analysing and processing the images was Persistent Scatterer Interferometry. We have applied PSI method and it was capable to give us an image about surface movements of Hessigheim.
As we used one dataset of (TerraSAR-X in descending direction) and two datasets of (Sentinel-1 in both ascending and descending directions), we have successfully made comparison between those two sources. The comparison methods depended on three criteria: density of persistent scatterers that produced from each dataset, deformation analysis as well as overall quality of results. Processing of TerraSAR-X has detected much more objects (areas) in Hessigheim than sentinel-1. Moreover, TerraSAR-X gave an analysis about surface movements with less noise than sentinel-1 and that was clear in time series deformation results. The reasons behind that are, TerraSAR-X uses short X-band that provides a high sensitivity to smaller surfaces movements [small pixel size (1 m x 1 m)], and second reason is that TerraSAR-X images are taken by spotlight mode. This mode acquires the images in small scenes (10km width and 5km length). In opposite, Sentinel-1 uses interferometric swath (IW) which acquires the images in large swath width (250 km) and that produces more noise. As a result of that, we can conclude that sentinel-1 can monitor the areas or objects, but if you wish more details, TerraSAR-X would be the best option.
The results of this thesis can be used as a reference for engineers or companies to decide which source of data they can use for an application (costly source or free source). This may help him to decrease costs for the projects.
References
PS Tutorial (2014), Sarmap SA, Switzerland. Online Access: http://www.sarmap.ch/tutorials/PS_Tutorial_V_0_9.pdf
Sentinel-1, from Wikipedia. Online Access: https://en.wikipedia.org/wiki/Sentinel-1
Sentinel-1, ESA’s Radar Observatory Mission for GMES Operational Services. Publisher: ESA Communications ESTEC, PO Box 299, 2200 AG Noordwijk, The Netherlands, 2012.
Online Access: https://sentinel.esa.int/documents/247904/349449/S1_SP-1322_1.pdf
Bamler R and Hartl P (1998) Synthetic aperture radar interferometry. Topical Review, German Aerospace Center (DLR), Wessling, Germany and Institute of Navigation, University of Stuttgart, Stuttgart, Germany
Kampes B (2006) RADAR INTERFEROMETRY Persistent Scatterer Technique. German Aerospace Center (DLR), Germany
SARscape 5.4.1 Help Manual (2017), HARRIS Geospatial Solutions.
PS Tutorial (2014), Sarmap SA, Switzerland. Online Access: http://www.sarmap.ch/tutorials/PS_Tutorial_V_0_9.pdf
TerraSAR-X, The Copernicus Space Component- Data Access. Online Access: https://spacedata.copernicus.eu/web/cscda/missions/terrasar-x
Exploring the SARscape Modules for ENVI. ITT Visual Information Solutions, 2010
Mahapatra P (2016) TerraSAR-X SpotLight analysis of Hessigheim, Besigheim and Felsengarten.
ESA, Copernicus Space Component and Data Access.
Online Access: https://spacedata.copernicus.eu/web/cscda/home
SAR Imagery, TRE ALTAMIRA: World leader in displacement monitoring services with satellite radar data. Online Access: http://tre-altamira.com/technology/sar-imagery/
Ansprechpartner

Uwe Sörgel
Prof. Dr.-Ing.Institutsleiter, Fachstudienberater