Jumadi Jumadi
WebGIS for Visualization and Spatial Analysis of Cadastral Information System using Open Source Software
Duration of the Thesis: 6 months
Completion: January 2018
Supervisor: Dr.-Ing. Volker Walter
Examiner: Prof. Dr.-Ing. Uwe Sörgel
Introduction
There is a growing need for digital land-based data information as a tool for legal, administrative, economic and decision making as well as a primary tool for planning, development, control, and analysis of land resources. This tool is also called as digital LIS (Land Information System). The specified land units and the data containing is a fundamental base of digital LIS. The digital LIS must serve a multipurpose use and meet the challenge of a modern Geographic Information System (GIS) and Information Technology (IT) environment. The quantity of the spatial and non-spatial data, the speed of data processing, how to manipulate and analyze these data, automated data updating, and how to distribute the spatial and non-spatial information to users are an essential thing in the digital LIS. In digital LIS application, there is a need for a WebGIS system to allow timely information on land-based units to be accessed, viewed, integrated, analyzed and shared as needed by all users anytime and anywhere.
This research intended to provide an accessible WebGIS prototype consisting of spatial and legal information related to Cadastral Information System of Padang Panjang city, West Sumatera, Indonesia. The final product is visualization and interactive spatial application of Land/Cadastral Information System of Padang Panjang City, Indonesia (CISPP) based on land units (parcels) which supports continuous, readily, available, comprehensive land related information, interaction map, spatial analysis, and attributes information at the land parcel level.
GIS data of Padang Panjang city was collected from different governmental institutions, edited, and processed by using Quantum GIS. A database was designed and populated by using PostgreSQL/PostGIS. GeoServer as Internet Map Server was selected to use in this project because it can easily convert from SHP form to JSON form without the help of other applications such as ArcGIS and QGIS. Leaflet.JS was selected to makes it easy to put a dynamic map in any web page. All these tools then customized and enhanced with others web programming languages such as PHP, HTML, CSS, JavaScript, Bootstrap, AJAX, and JQuery to perform GIS layer visualization, interactive mapping, spatial queries on searching, and spatial analysis. Security access is also performed in this research since the data regarding land parcel is sensitive information.
Material and Methodology
A. Study Area
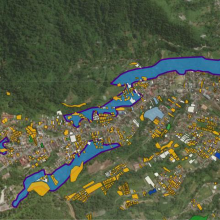
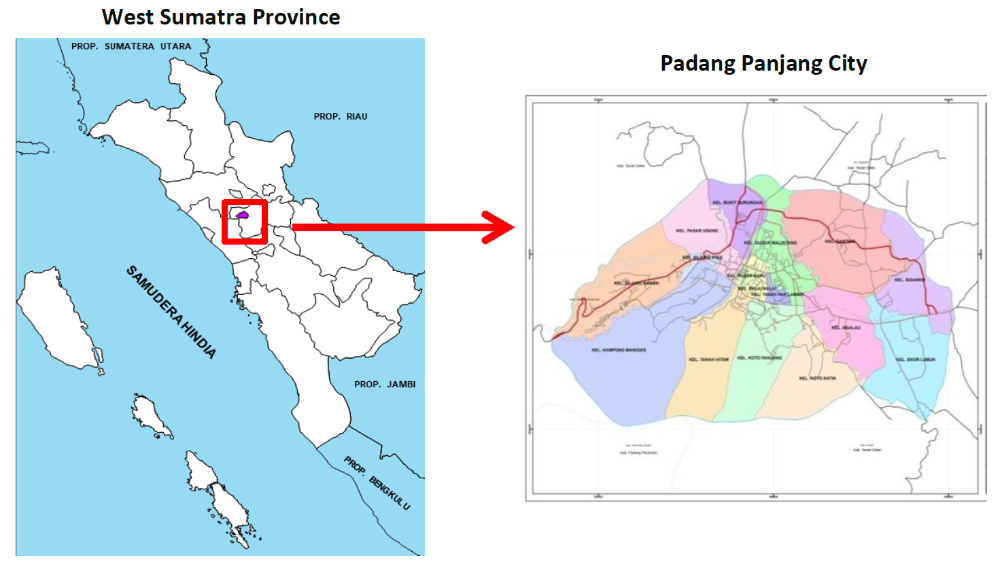
Padang Panjang city which is located in West Sumatera province Indonesia is selected as the study area in this research. Padang Panjang is a small city which is located in the cool highlands of West Sumatera, inland from the provincial capital Padang. It sits on a plateau beneath the volcanoes Mount Merapi and Mount Singgalang. It has an area of 23 km² and a population of about 50,000. It lies between Longitude 100⁰ 22’ 13’’ E to 100⁰ 228’ 13’’ E, Latitude 0 25’ 20’’ N to 0 29’ 07’’ N [2]. Graphical representation of study area is given in figure 1 below.
In this research the data is collected from local government (Padang Panjang City), Ministry of Forestry Republic of Indonesia, and Ministry of Agrarian Affairs and The Spatial Planning Republic of Indonesia. Data used are described below:
- Land Parcels/ Land Ownerships and their attributes (Shapefile format)
- Land Use and their attributes (Raster format)
- Land Value and their attributes (Shapefile format)
- Forestry Map and their attributes (PNG format)
- Administration Boundary Map, Roads, Railway, river lines (Raster format)
- National GCPs and their attributes (Ground Control Points, CAD format)
- Land Slope (Raster format). Data source: Local Government of Padang Panjang City
- Satellite Imagery (Global Base Map (GBM))
B. Methodology
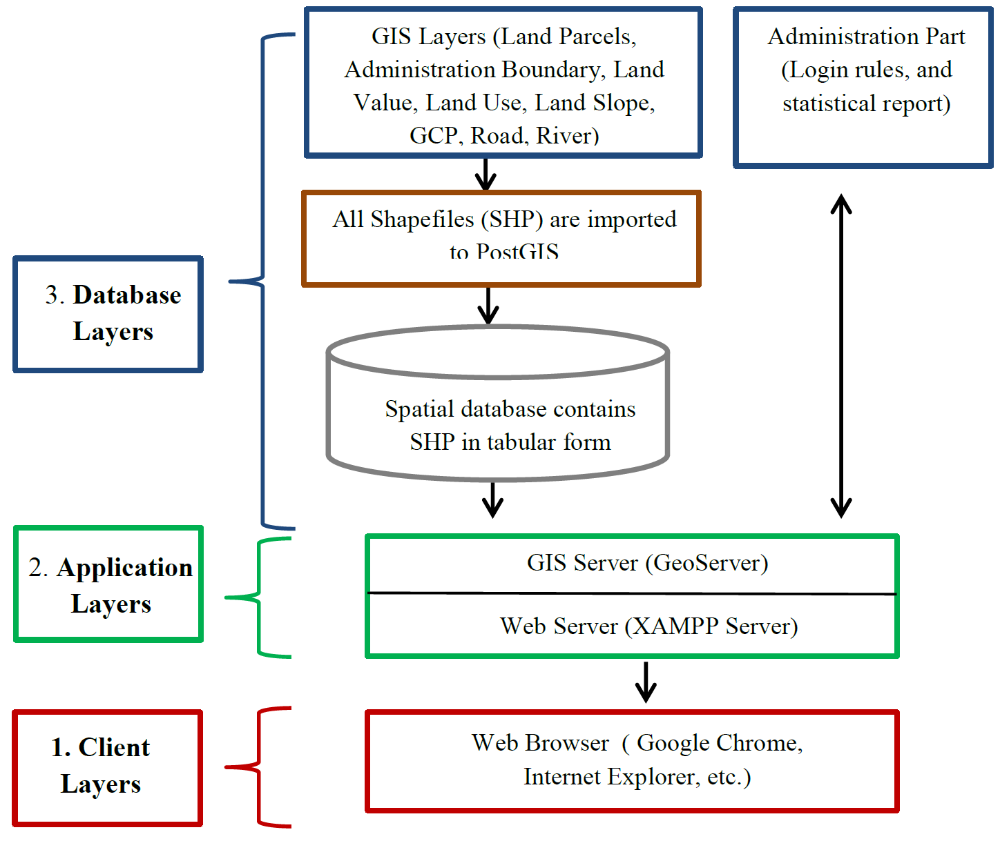
The methodology for the development WebGIS Cadastral Information System of Padang Panjang City, Indonesia (CISPP) is given in figure 2 below. All the technologies followed in the present study. The methodology was designed using three levels of layers: 1) Client Layer 2) Application Layer 3) Database Layer The Client Layer contains web pages which are designed using HTML, CSS, AJAX, JavaScript, and Leaflet.JS. The Application Layer has two servers, XAMPP server which handles HTTP requests and second is GeoServer which handles map requests by client layer. The third layer is Database Layer which contains all GIS layers which are imported to PostGIS by using QGIS DB Manager.
C. Spatial Data Processing and Database
In this part, we will process all of the data sources by using spatial processing program called Quantum GIS (QGIS).
Raster Format (PNG)
The raster data format are digitized using QGIS. Georeferencing by using satellite imagery (Global Base Map (GBM)). Digitizing Based on data feature continue with creating attributes table and the final product is Shapefiles (SHP), WGS 84
Vector Format (SHP)
In this step, we will apply spatial data processing (spatial join) to achieve land parcel which contains information about land use, land value and land slope (complete information in each parcel)
Automatic Symbology
This stage aims to automatically copy a symbology code inside a polygon object (attributes) into a column in the table attribute on the polygon layer (attributes) into a column in the table attribute on the polygon layer. This step later is used to simplify the coding language or script that we will create. If this stage is not done, then we must write a script to translate symbology each attribute table one by one and this way is very ineffective. The process is done by using Python script and then executed by enabling QGIS Python Console tool.
Spatial Datasbase Design
In this part, we will create a spatial database which provides all spatial layers (WFS links) and updates spatial data automatically. The combinations of 3 GIS software (QGIS, PostGIS, and GeoServer) are used to achieve these results. In the process of making this spatial database, all vector data will be stored in the database in PostGIS whose purpose for data storage more neat and structured, then the process of entering vector data into the database will be done by importing using Quantum GIS software. The data already in the database will be connected to GeoServer and from GeoServer will be called in the GeoJSON link into the WebGIS compiler script.
D. Software and libraries Used
- QGIS is an open source GIS software that is used spatial data processing
- PostgreSQL and POSTGIS is used for spatial data storage and processing
- XAMPP server is used to handle HTTP request made by client
- GeoServer is a server used for GIS purposes such as sharing, processing and editing GIS data
- PHP is a server-side language for web programming that was originally a CGI program dedicated to receiving input through a form in a browser display
- The Leaflet JavaScript is a free and open source which provides many plugins for geospatial applications
III. Result
A. Online Visualization of GIS Layer
This application has some main functionalities which are given below (see figure3):
- Layer Control to select which layer that want to be displayed
- Popup menu to display all attribute contained
- Image or raster overlay and Image background (Leaflet Base map)

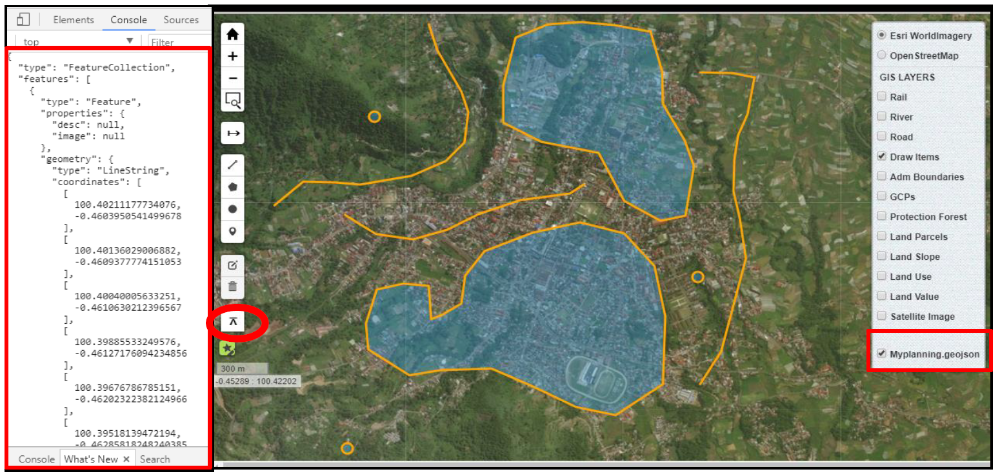
B. Interactive Drawing
This application has some functionalities as follow (see figure 4):
- Drawing tools and styling
- Convert project to GeoJSON format
- Add/load GIS data to WebGIS application
C. Query Implementation On Searching
The query implementation on searching was performed by combining some programming languages such as PHP, HTML, CSS, Bootstrap, JavaScript, and JQuery. The result of this functionality is highlighted by a color boundary or by a marker. The primary function of this functionality is helping the user to find particular land parcel or location on the map. The result of this application can be seen in figure 5 below.

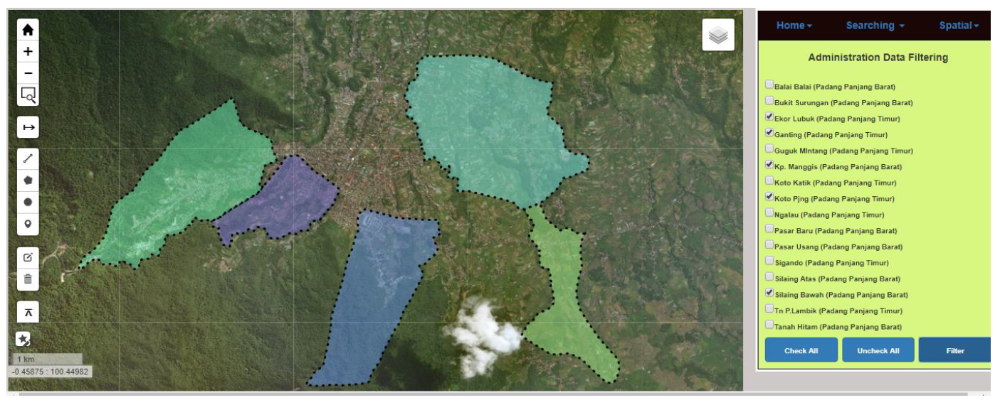
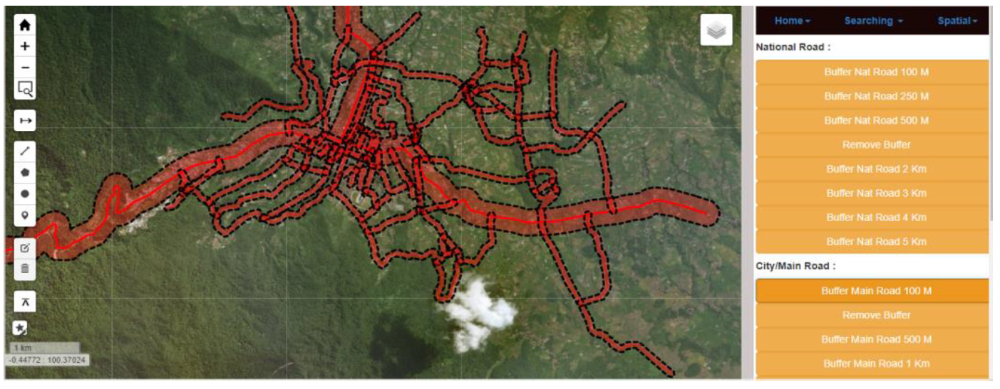
D. Spatial Analysis Tools (Filtering and Filtering)
In this research, spatial analysis tools (filtering and buffering) was created that can be applied to the web platform whose primary purpose is to be able to analyze the land data interactively. Some programming languages such as HTML, CSS, Bootstrap, JavaScript, and Turf.JS will be used to create and develop this toolbar. The result of these applications can be seen in figures 6 and 7 below.
E. Spatial Analysis Application
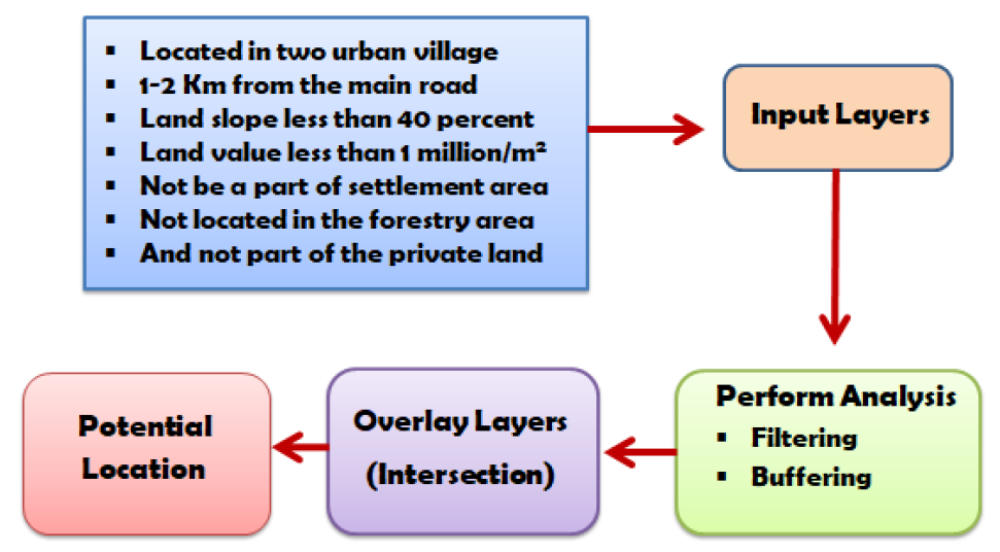
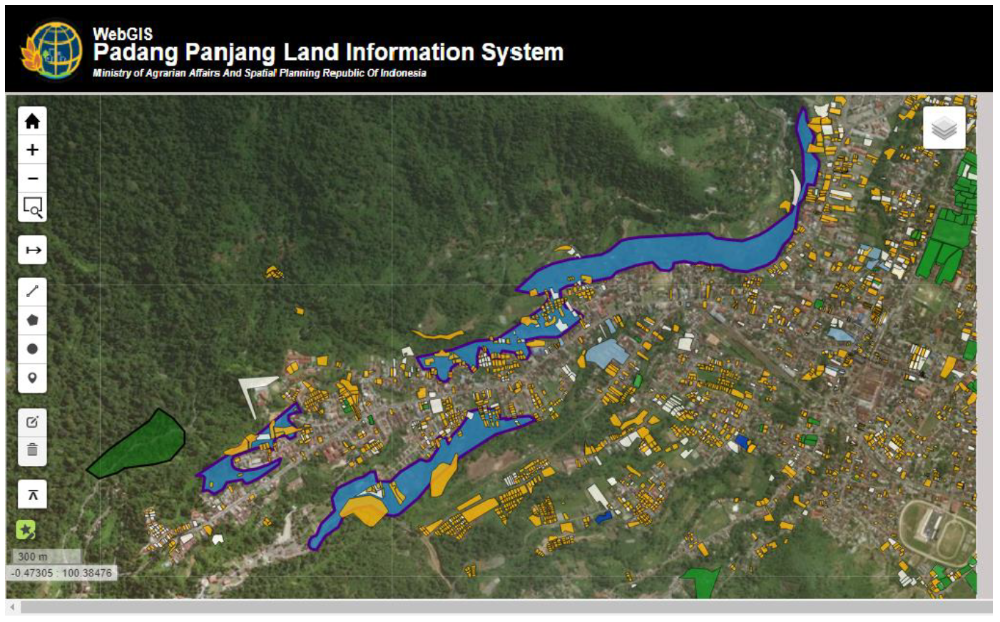
Spatial analysis is a set of techniques that can be used in GIS data processing. In GIS data processing, spatial analysis can be used to provide solutions to spatial problems. In this part, the spatial analysis application will be performed to identify free-state land to build hotel/resort by using various parameters or criteria. The process and result of spatial analysis application can be seen in figures 8 and 9 below
F. Security Login for Authorized Access
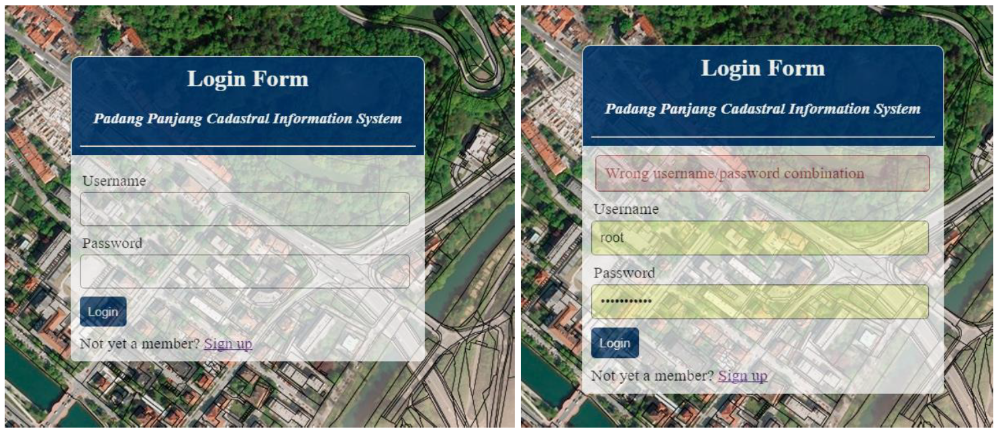
Login is an important process on a website, website based applications, and other applications that restrict access by users for not accessing the inside of the system such as part of the admin. Therefore login is used as security for data or each account. If a website does not have a login process, then everyone will be able to access the admin page and can freely to update posts, delete posts or freely scramble the contents of the website. When a user fills the details like username and password and press 'login' button then, login detail is compared with detail presents in a database (MySQL), if a user is not authorized then it shows a warning message (see figure 10 below)
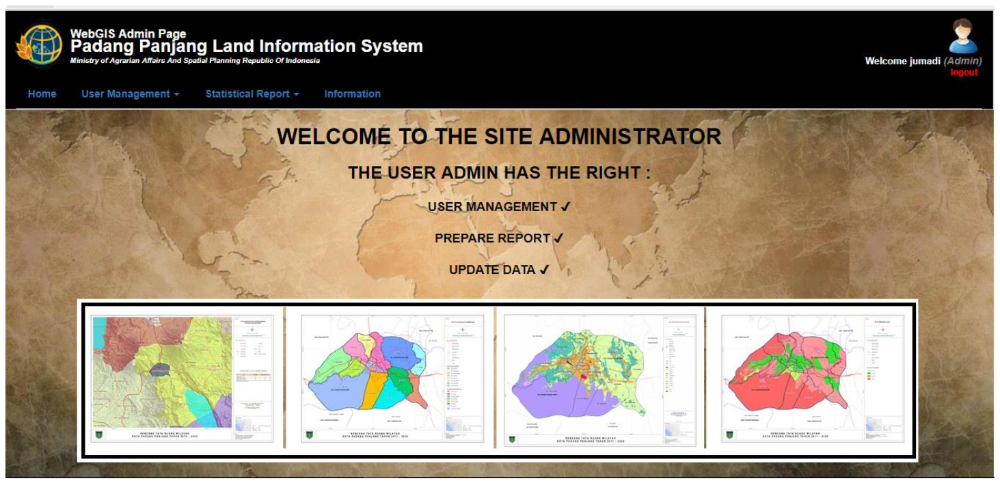
G. Administration Part
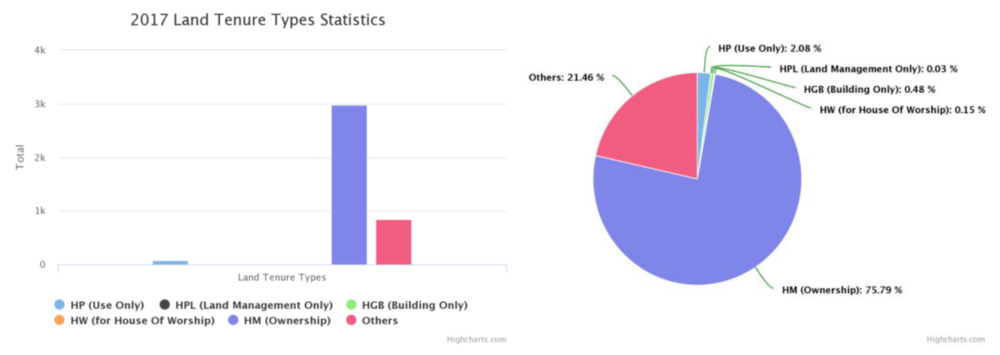
In Administration part, there are some facilities which are provided for the administrator to check the list of the user, create new user, and geo statistical data report. The administration part can be seen in figure 11 and 12 below.
Conclusions
- There is a growing need of WebGIS cadastral/land information as a tool for legal, administrative, economic and decision making.
- QGIS, GeoServer, PostgreSQL/PostGIS, LeafletJS work optimal for developing WebGIS application
- Leaflet provides a lot of Plugins (GIS power)
- Interactive map application is the key of Cadastral web application
- Spatial analysis tools is a power of WebGIS
- Security login is needed since the data is sensitive
Ansprechpartner

Volker Walter
Dr.-Ing.Gruppenleiter Geoinformatik