Elyor Farmonov
Implementation and Evaluation of a Crowd-based Approach for Georeferencing of Raster-Maps
Duration of the Thesis: 6 months
Completion: September 2017
Supervisor: Dr.-Ing. Volker Walter
Examiner: Prof. Dr.-Ing. Uwe Sörgel
Introduction
Today, the digital world is in the new phase, we are facing more and more new border-less technologies - social networking sites, video upload-watch sites, web applications, data transfer environments, etc. The term “Web 2.0” binds them together. A unique and growing part of Web 2.0 technology - Crowdsourcing is our main interest in this thesis.
Geographic Information System (GIS) deals with vector, raster data and the process of conversion from one to another, mostly raster maps have to be converted to vector maps – the final goal of which is to get coordinates of specific points on a map (pixel). Georeferencing - relating information to geographic location or the process of assigning real-world coordinates to each pixel of the raster. In case of huge volumes of data aforementioned task requires much effort and time. In order to overcome such difficulties: the idea of obtaining georeferenced maps via applying crowdsourcing technique on the Internet was introduced as a topic of research by my supervisor. After discussions and consideration on turning points it was not difficult to conclude that this topic was best fit for me with my background knowledge on required fields.
A web application (eventually located on the address http://webcrowdsourcing.eu/) had to contain, based on our initial ideas, two important parts:
- A Graphical User Interface (GUI) - where user interaction, auto-computation and data-send are managed.
- Administration - quality control and confirmation of acquired data.
Crowdsourcing
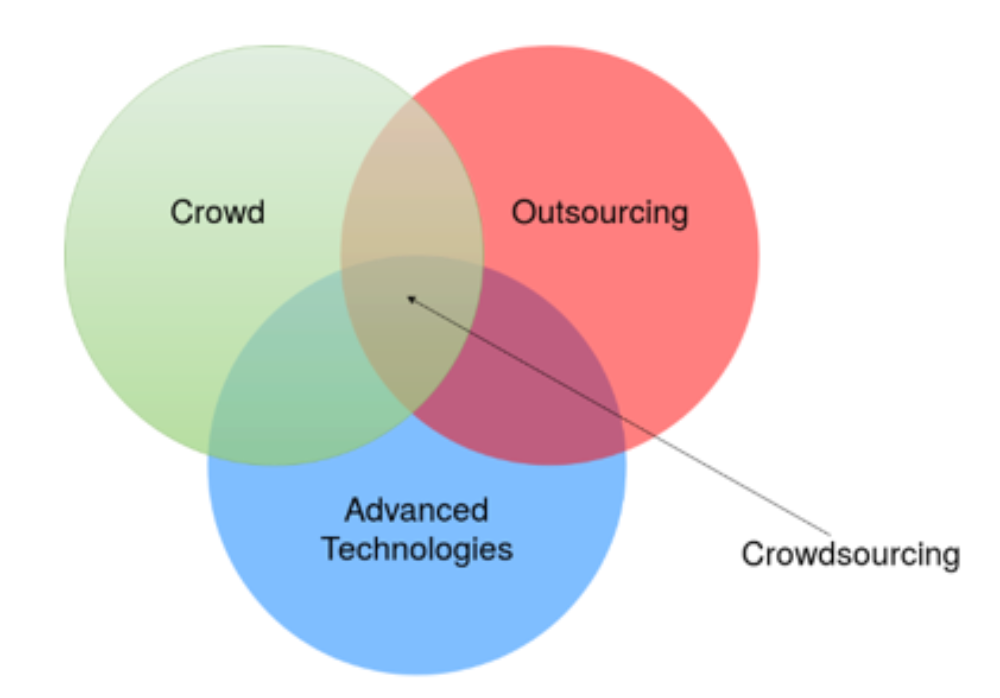
(Redrawn and adapted from “Rules of Crowdsourcing”)
A comprehensive definition that fits to up-to-date “crowdsourcing” term from author's point of view is stated below (by Gregory D. Saxton, Onook Oh and Rajiv Kishore):
Crowdsourcing is a sourcing model in which organizations use predominantly advanced Internet Technologies to harness the efforts of a virtual crowd to perform specific organizational tasks.
How to organize crowdsourcing? Based on review of literature and experience gained during the practical realization of crowd-sourcing for this thesis, the four step simplified framework for organizing crowdsourcing is derived.
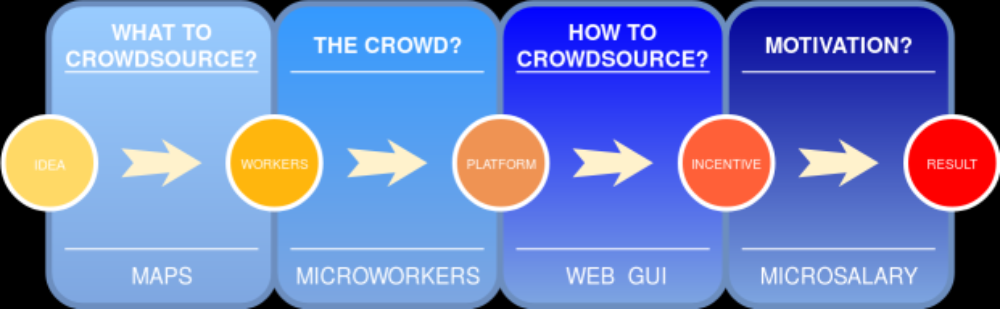
*Microworkers.com – International online platform that connects employers and workers from around the world.
Objectives
- Development of a web application with the aim of investigation crowdsourcing effects.
- Integrating the application with the Microworkers platform.
- Testing and evaluation of acquired results.
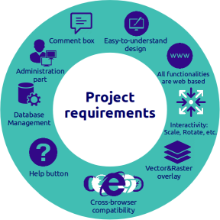
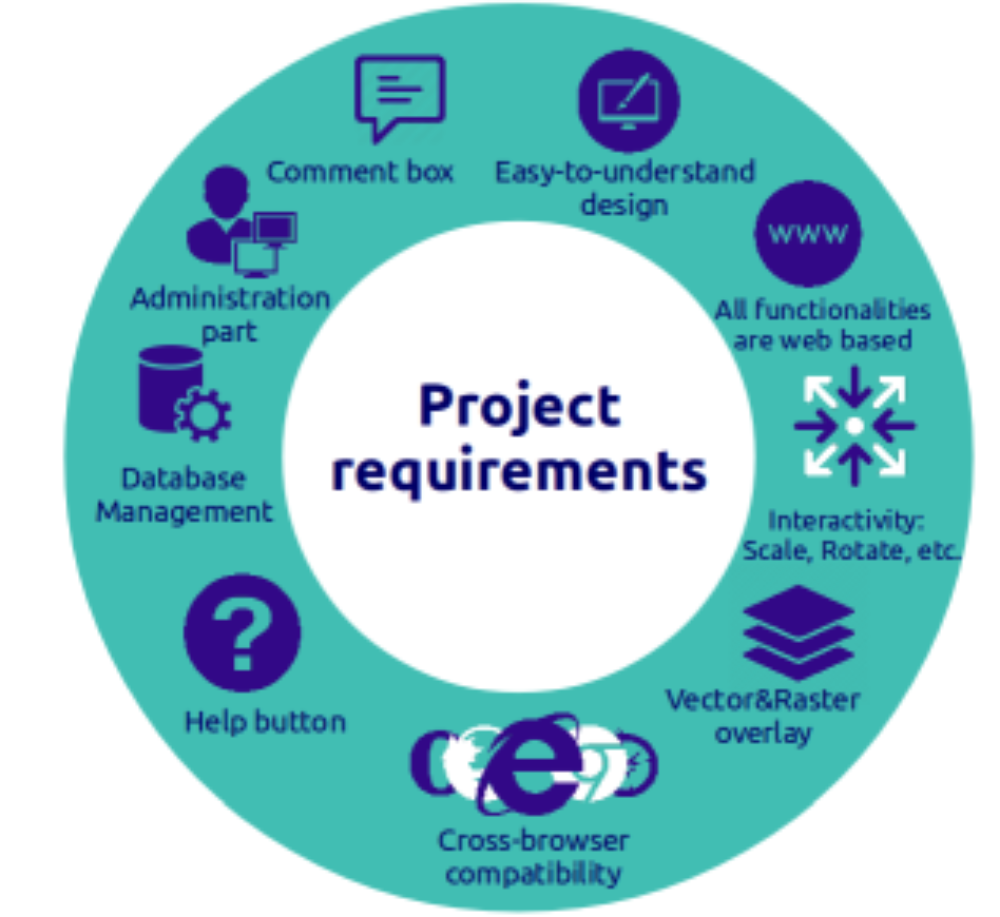
Project requirements
The author investigated similar projects, their positive and negative sides in order to have a clear picture of the development direction. New ideas came to mind which had to be organized and developed. For that purpose, based on time and resources below depicted (fig. 3) general requirements were written.
Methodologies
In order to meet requirements we should have applied suitable web programming languages, libraries, APIs, database management applications, etc. In addition to cornerstone elements such as HTML (HyperText Markup language) and CSS (Cascading Style Sheets), Javascript, PHP and SQL languages were used.
Javascript – object-oriented, flexible and dynamic language for browsing (used libraries: JQuery, Leaflet and D3 – data-driven documents).
PHP (Hypertext Preprocessor) – open-source, general purpose programming language. Widely used as a server language.
SQL (Structured Query Language) – controls user-database interaction and supports query language.
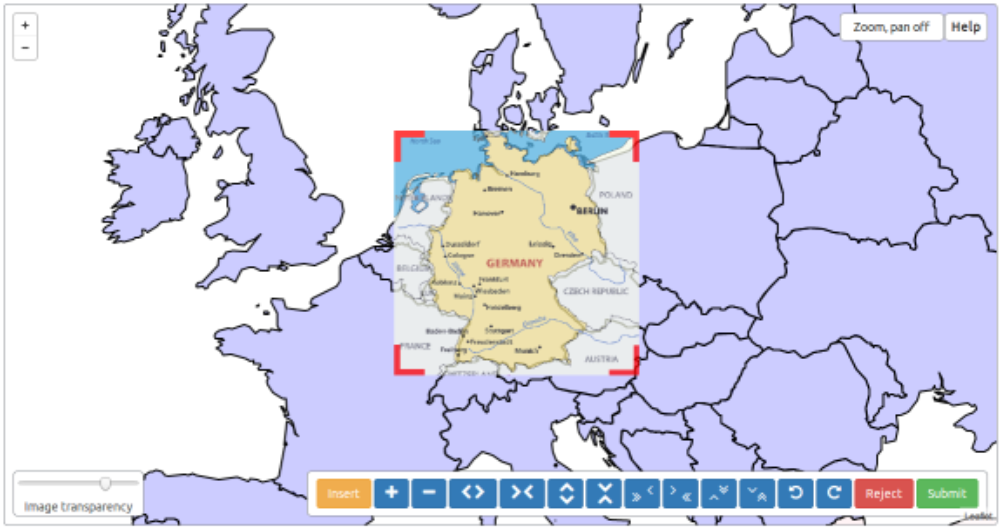
After the successful software development via above listed programming languages, the result (the Graphical User Interface) illustrated in figure 21 was obtained.
Tests and Results
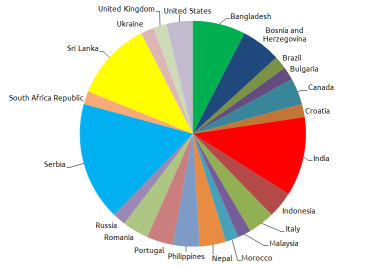
In the first campaign 53 microworkers were participated. More than half of participants completed tasks remotely from Serbia (9), India (6), Sri-Lanka (6), Bangladesh (4) and Bosnia-Herzegovina (3). The rest were from different countries, e.g. Morocco or Portugal (see fig. 34). In general, users could grasp the idea effortlessly. However, among them three could not complete the given task in 3 attempts.
 |
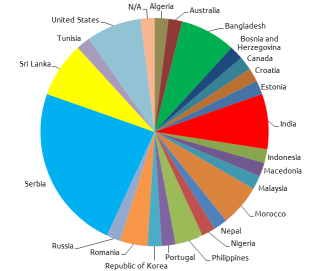 |
| Figure 34: Origin of participants (campaign 1) | Figure 35: Origin of participants (campaign 2) |
In the second campaign the number of microworkers, less than the previous campaign, was 51. Similar picture can be observed in distribution of participants' origin (see fig.35). Top 5 countries were Serbia (12), India (4), Sri-Lanka (4), Bangladesh (4) and the United States (4) (Bosnia-Herzegovina was in the first campaign). It is evident that the majority of participants are from Eastern Europe and the South Asian countries. During the process only one user could not finish his task in 3 attempts. Compared to the first, the second campaign was faster and attempts were less. Results are stated in the following subsection.
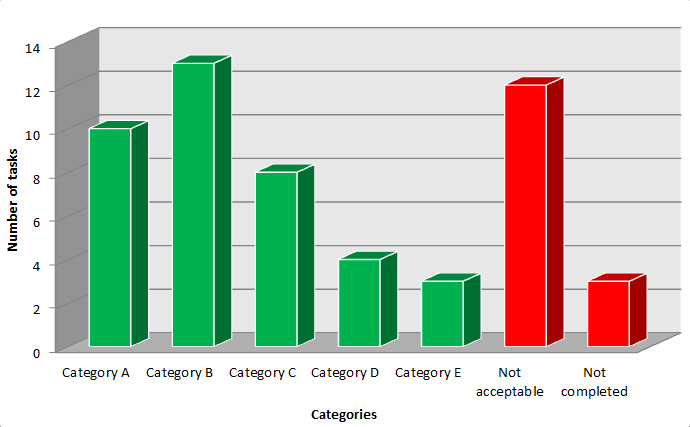
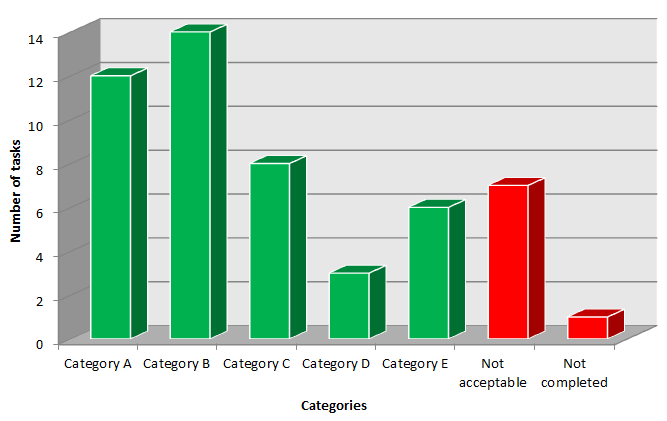
The obtained results of both campaigns were categorized according to the criterion. A task is not acceptable if an evaluated value is more than 100 kilometers. In other case, depending on a value a task is categorized as A, B, C, D or E. The highest category (the most correct) is A, the lowest is E.
It is clear from the bar chart below that the number of tasks in categories A, B and C form the main part of the accepted tasks. Obviously, quality of overall result was assumed as desired. However, the number of unsuccessful tasks consisted more than quarter of all tasks. The success rate of the first test campaign (the sum of accepted tasks (green) / the sum of all tasks) was 71.7%.
 |
 |
| Figure 36: The categorization chart for the test campaign 1 | Figure 37: The categorization chart for the test campaign 2 |
Similar structure was observed after the categorization of the second campaign results. The tendency of unsuccessful tasks were declined, consequently the success rate climbed and showed 84.3%. Two important factors were behind this change: (1) as stated in the second campaign informative data were used, (2) some of users had experience after the first test campaign.
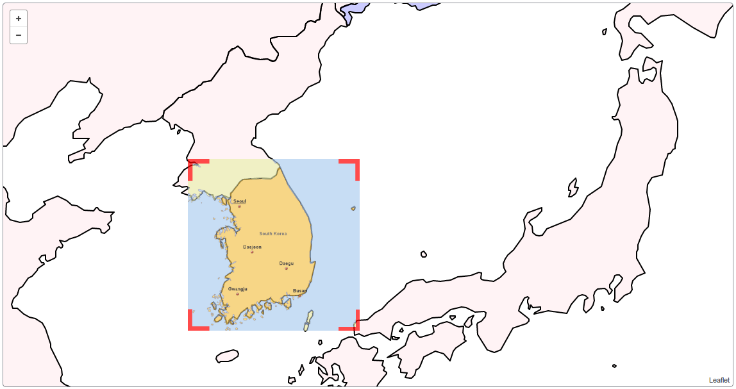
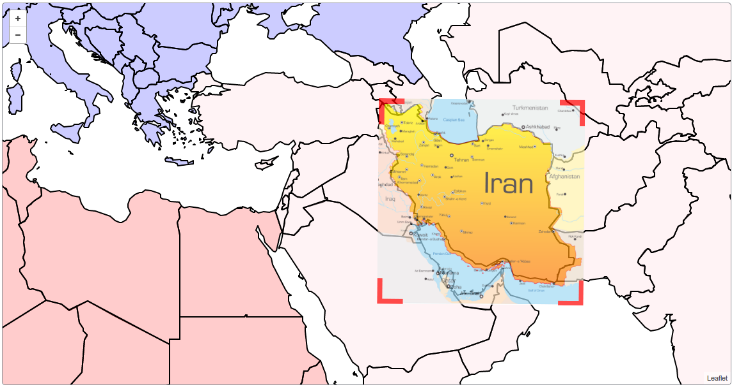
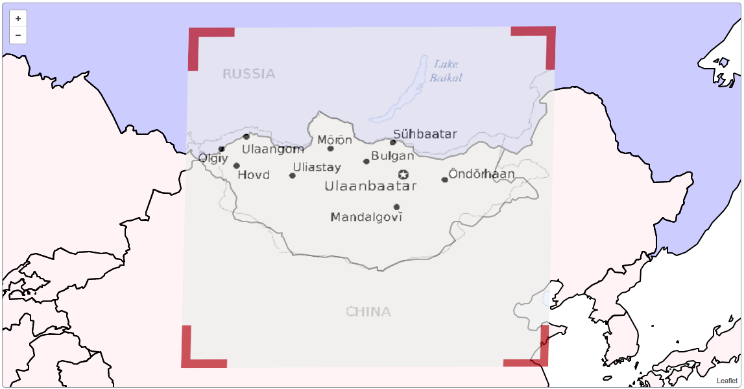
Illustrated are examples of six completed tasks from different users.
 |
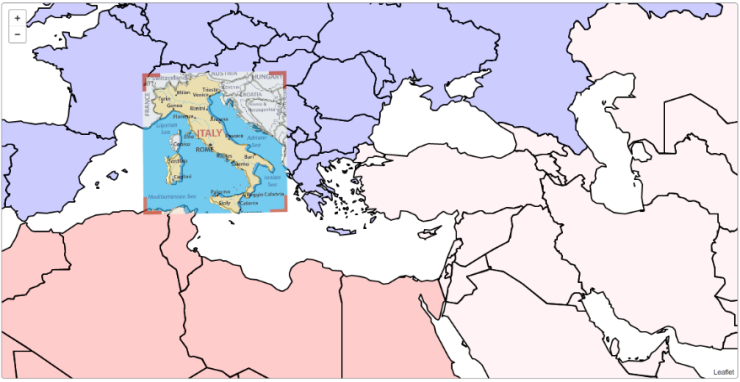 |
| Figure 38: Category A: the raster-map of South Korea | Figure 39: Category B: the raster-map of Italy |
 |
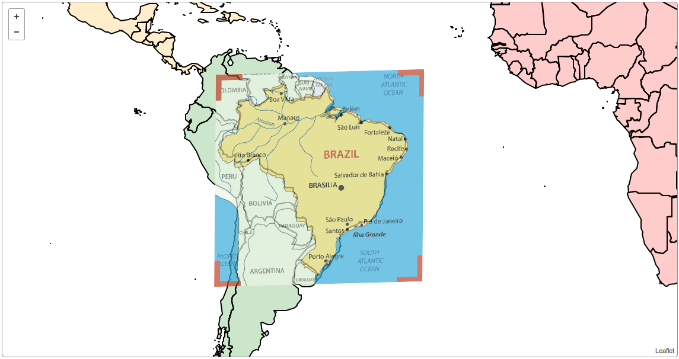 |
| Figure 40: Category C: the raster-map of I.R.Iran | Figure 41: Category D: the raster-map of Brazil |
 |
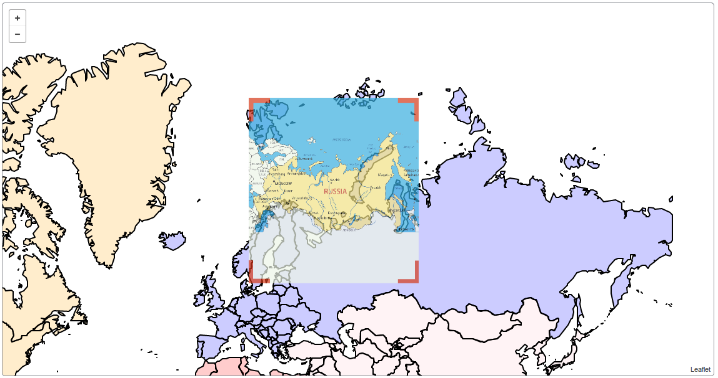 |
| Figure 42: Category E: the raster-map of Mongolia | Figure 43: Not acceptable: the raster-map of Russia |
Summary and future work
This thesis has created a number of research and development lines that should be explored in the future. At first, we discuss about development lines and changes which affect positively to the project. It is necessary to admit that many functionalities can be added to have more productive and flexible web application. For instance, one of feedbacks regarding the Graphical User Interface stated as: “It is easier to interact with mouse clicks directly to the raster map (i.e. similar functionality for scaling, rotating in Microsoft Office Word for images) rather than clicking on buttons". Indeed, this suggestion is meaningful and the author is ready to develop and adopt this functionality to the web application. Followings also might be realized in future:
- Fully automated evaluation - checking every task manually, conforming if a task is completed correctly might be strenuous in case of large amount of data. It would be very useful if a method is developed to overcome this issue.
- Precise background map. This problem was solved during the development process. There is a reason why we did not use the solution. It requires to spend Internet data which costs more than offered microsalary.
- Data upload functionality - I would like to georeference my raster map online as a user with fast upload/download possibilities. This functionality can boost a user flow of the web application.
The listed below research directions should be considered in future:
- Implementation of algorithms to find map patterns for map matching
- Crowd-based evaluation of geodata acquired via crowdsourcing
Many software applications are migrating from desktop space to web space and office works are changing to home based works. From this trend, it can be concluded that the combination of crowdsourcing and web applications can have a positive impact on the whole Geographic Information System field.
References
D3 - Data-Driven Documents. Online access: https://d3js.org/
Daren C. Brabham Crowdsourcing 2013: Massachusetts Institute of Technology. Online access: http://wtf.tw/ref/brabham.pdf
Ducket J. HTML&CSS Design and Build Websites 2011: John Wiley&Sons, Inc. 10475
Crosspoint Boulevard Indianapolis, IN.
Gregory D. Saxton, Onook Oh and Rajiv Kishore Rules of Crowdsourcing: Models, Issues, and Systems of Control 2013: 30:1, 2-20
Leaflet. Online access: http://leaetjs.com/
Microworkers - crowdsourcing platform. Online access: https://microworkers.com/
O'Reilly school Advanced JavaScript Essentials 2014: O'Reilly Media, Inc.
Ansprechpartner

Volker Walter
Dr.-Ing.Gruppenleiter Geoinformatik