Florin Lucaciu
Estimating Pose and Dimensions of Parked Automobiles on Radar Occupancy Grids
Duration of the Thesis: 6 months
Completion: July 2017
Supervisor & Examiner: Prof. Dr.-Ing. Uwe Sörgel
Introduction
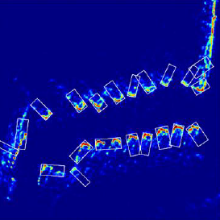
The automotive industry has become more focused in the last years on developing Autonomous Vehicles or at least Advanced Driver Assistance Systems. For such platforms to be functional, one of the key components is represented by the environment perception and scene understanding modules. Recently, Radar technology has become a popular choice in gathering data about the car’s surroundings, because it demonstrates robust behavior under different atmospheric and driving conditions. The vicinity of the car is mapped based on observations delivered by the Radar sensors for each detected reflective target: range, angle of arrival, amplitude and Doppler velocity. One convenient representation of the environment is the Occupancy Grid Map, which assigns a two-dimensional tessellation of space around the vehicle and returns for each cell the probability that it is occupied.

Methodology
The thesis proposes two different methods to accomplish the aforementioned goal. The first one is based on Feature Engineering and it uses basic image processing techniques, as well as computational geometry to deliver hypotheses about extracted objects from the input maps. In short, candidate objects are extracted by thresholding the original image and then oriented bounding boxes are applied to the enclaves; the boxes are afterwards expanded to include the full extent for each parked automobile. Although the procedure proves to be effective in some cases, the entire data set contains much more variation and noise than the designed rules and criteria can account for. The performance of this method is thus limited and the main problems refer to a large number of false positives, as well as misalignment of some boxes with the cars’ true orientation.
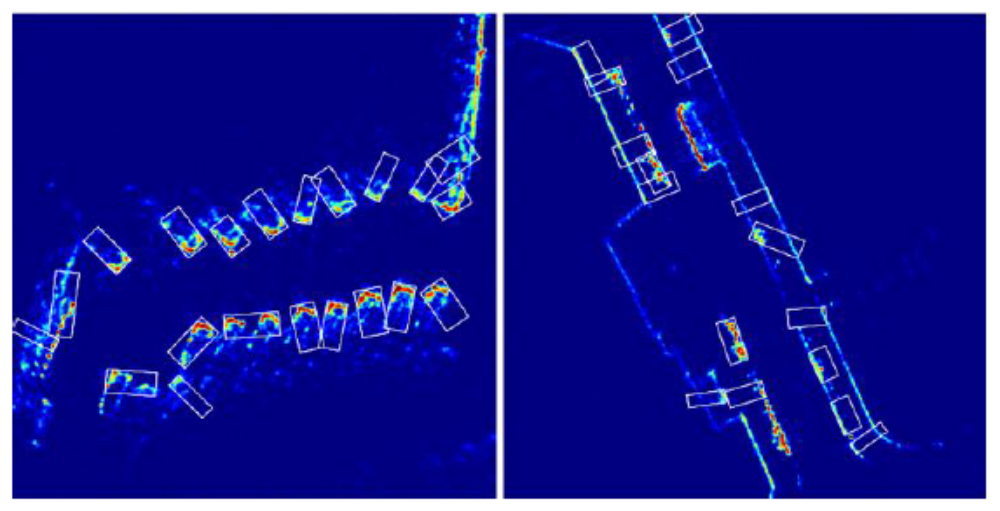
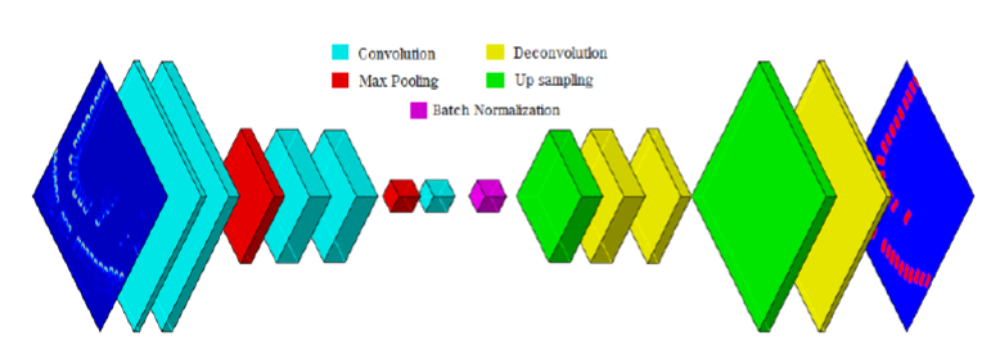
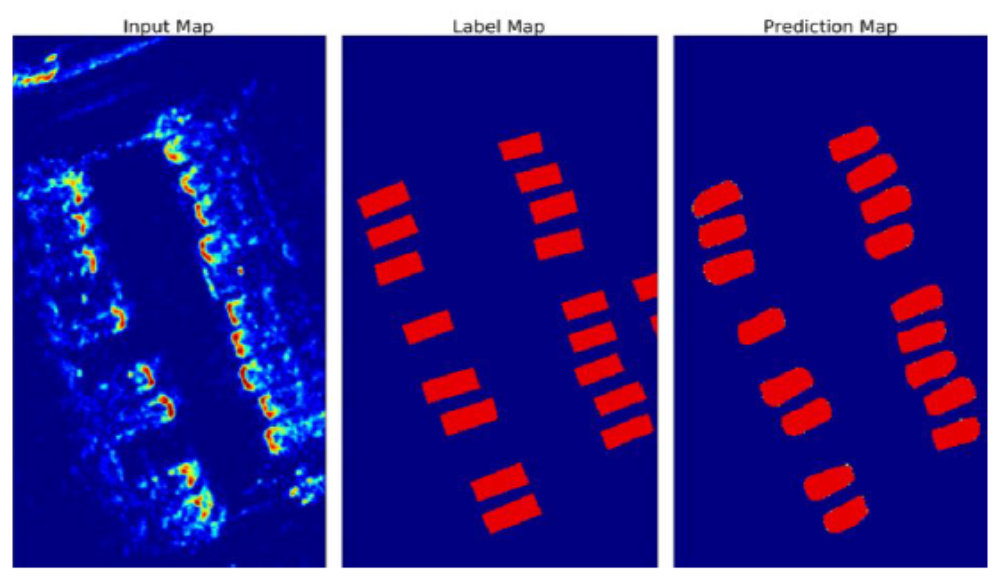
The second method involves Semantic Segmentation or pixel wise classification, through a Convolutional Neural Network (CNN) with an encoder-decoder architecture. This is a Deep Learning structure based on a Supervised Learning algorithm. Through repeated convolutions and down sampling layers, a process of abstraction, similar to that taking place in the biological visual cortex, is achieved, encoding high level information about each pixel. However, this procedure leads also to a loss in resolution, therefore the second part of the network has, among others, the role of getting the feature maps back to the original size; this is done through repeated layers of deconvolutions and up sampling. By considering such a high number of feature maps, a very complicated function is encoded into the entire structure (Figure 3). Activation functions after each convolution/deconvolution layer (Relu – Rectified Linear Unit and Sigmoid) ensure the nonlinearity aspect. The last layer outputs a map in which each pixel contains the probability that it belongs to the class Car; thus it is a binary classification: Car vs. Background.
More than three million parameters contained in the network’s layers are optimized through a Gradient Descent algorithm. The prediction maps are compared to the manually labeled maps, using the following Cost function, approximating the Intersection over Union score:
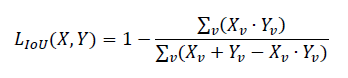
ν is a subset of cells (mini batch) from the training maps collection, X is the output of the final Sigmoid layer from the CNN – representing the probabilities that the pixels belong to the class Car – and Y is the expected (ground-truth) classification, representing Background pixels with 0 and Car pixels with 1. The Cost function is minimized in the process of training, accounting also for the heavy class imbalance, which could determine a strong bias of the classifier towards the dominant class (Background).
Evaluation
|
Method |
Feature Engineering |
Semantic Segmentation |
|
True Discovery Rate |
70.44% |
89.97% |
|
False Alarm Rate |
56.79% |
16.20% |
Conclusion
The second approach, based on Convolutional Neural Networks clearly out performs the first one, by far. Supervised learning is a robust tool for solving complex tasks, increasingly gaining popularity in various domains, including Environment Perception in Autonomous Driving; the only disadvantage of this technique is the necessity of large amounts of labeled data for training, which involves a considerable logistic effort.
Ansprechpartner

Uwe Sörgel
Prof. Dr.-Ing.Institutsleiter, Fachstudienberater