Diandra ARINITA
Detecting 3D Building Symmetries – an Empirical Study
Duration of the Thesis: 6 months
Completion: April 2016
Supervisor: Dr.-Ing. Susanne Becker, Dr.-Ing. Michael Cramer
Examiner: apl. Prof. Dr.-Ing. Norbert Haala
Motivation
Heritage documentation is important for conservation, reconstruction, and education. 3D reconstruction model of heritage building is necessary for further analysis and evaluation. One of them is to define the characteristic of the object itself by identifying the existence of symmetries. If there exist a symmetry or symmetries, then a pattern could be detected. Hence the high level of shape or geometry recognition could be improved. A complete reconstruction using an incomplete point cloud data seems conceivable as one of the further goal of this study. An algorithm was developed in order to detect expected global symmetries using point cloud. Nowadays point cloud can be derived using range-based techniques and/or image based technique, mainly photogrammetry [1]. The algorithm of symmetry detection implemented for this study consists of three steps [3]: selection of features that are defined based on the principal component of every segment, clustering using hierarchical and or non-hierarchical method [4] to extract the symmetry lines and a robust verification based on transformation parameter of Iterative Closest Points [2].
Methodology
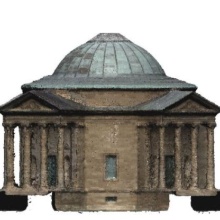
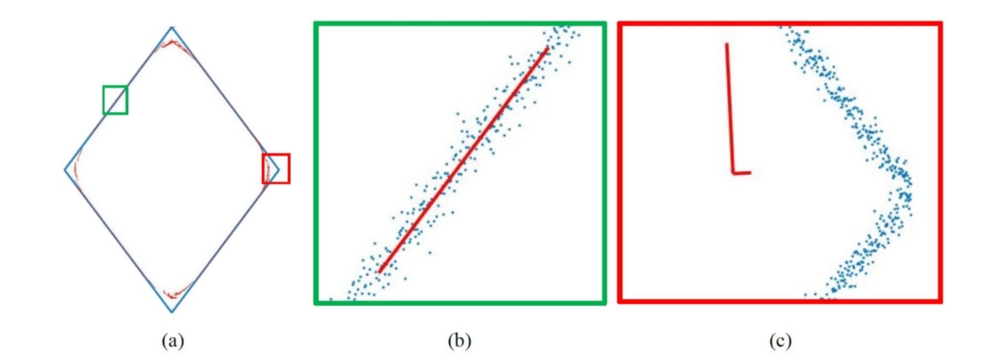
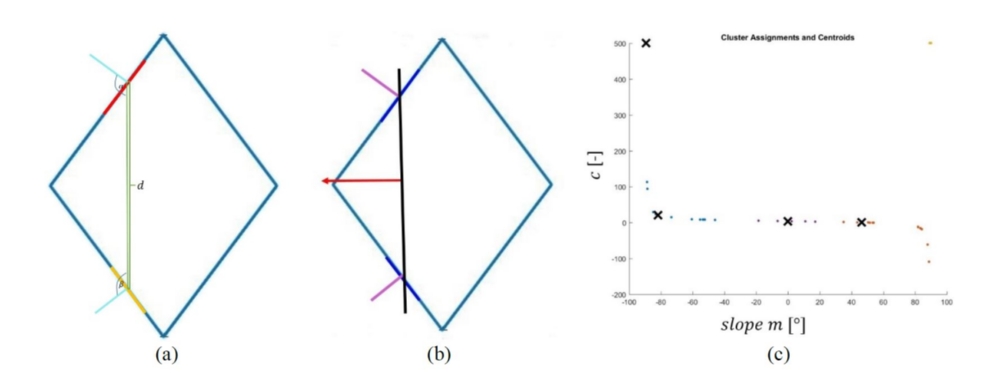
Data acquisition was performed by taking overlapping images around the object, taking care to respect the geometrical constraints in order to produce a strong network of camera stations. A number of aerial images were captured in around 10m distance from more than 3 different inclination angles. Pass points which are distributed across the façade were used as local reference for all photogrammetric images. Interior data is captured using laser scanner with several stations aligned using ground points that were measured using a tachymeter. For simplification purpose, interior and façade point clouds were sliced horizontally creating a number of cross sections (Fig. 1) which were then projected with a constant height. It reduced the dimension of point cloud from 3D into 2D space. The algorithm processing step starts with finding the necessary segments defined by finding the principal component for each segment. The ‘good’ segments were taken for further processing. The difference between good and bad segments can be seen in Fig. 2. The next step is calculation of normal vector of each segment. Then pairs of segments were selected to generate all the possible candidates for symmetry lines. Lines were represented in mathematical description (slope-intercept and standard form). Every parameter in each form represents the dimension for each line. This gives us points in 2D space for slope intercept and in 3D space for standard form. Meaningful symmetries can be extracted by looking for the big clusters exist among all symmetry line candidates. K-means and hierarchical clustering were used to derive the mean value of each cluster that represent the new symmetry lines. The process explained can be seen in Fig.3. Verification is needed to see whether the new symmetry lines are the meaningful ones by using the residual and the amount of transformation of Iterative Closest Points. The algorithm applied to sections that has been projected into 2D space.
Results
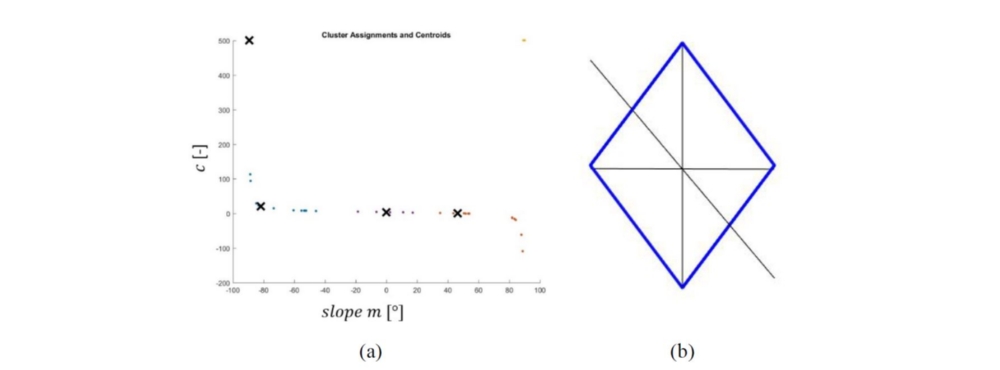
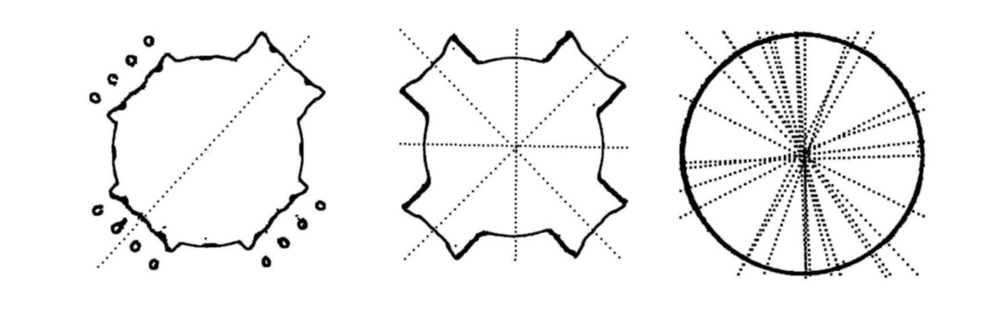
Data points in the shape of diamond was used as a preliminary test for the algorithm. Fig. 4(a) shows the result after symmetry parameter clustering using k-means method, while the verified symmetry lines, in the form of black lines going through the center of the object, can be seen on figure Fig. 4(b) for synthetic data. The empirical data with density point of ±1153 points / m3 for interior, while ±583 points / m3 for façade density points were used after the algorithm was considered to be successful with the synthetic data. A total number of 27 sections of interior and 31 sections of façade data, Fig. 5 and Fig. 6 show 3 different level of sections as an example of result where the dense points form the 2D projected points of object data points, while the sparse points represent the symmetry line/s. The accuracy of symmetry lines were derived from the value of mean squared residual. An average value of both data points were calculated and the result were 2.25dm for façade and 2.73dm for interior data points.
References
[1] Guarnieri, A., Remondino, F., & Vettore, A. (2006). Digital photogrammetry and TLS data fusion applied to Cultural Heritage 3D modeling. ISPRS. Dresden.
[2] Mitra, N. J., Guibas, L. J., & Pauly, M. (2006). Partial and approximate symmetry detection for 3D geometry. SIGGRAPH.
[3] Mitra, N. J., Pauly, M., Wand, M., & Ceylan, D. (2012). Symmetry in 3D Geometry: Extraction and Applications. EUROGRAPHICS.
[4] Yim, O., & Ramdeen, K. T. (2015). Hierarchical Cluster Analysis: Comparison of Three Linkage Measures and Application to Psychlological Data. The Quantitative Methods for Psychology.


Ansprechpartner

Michael Cramer
Dr.-Ing.Gruppenleiter Photogrammetrische Systeme