Tianqi Xiao
Flood detection with SAR data: investigating role of polarimetric decomposition and globally available labelled dataset in flood mapping
Duration: 6 months
Completition: July 2021
Supervisor: Prof. Dr. Mahdi Motagh (GFZ), Prof. Dr.-Ing. Uwe Sörgel
Examiner: Prof. Dr.-Ing. Uwe Sörgel
Introduction
Flooding is one of the most widespread and severe natural disasters. Deriving accurate and rapid cartographic information on flood extent is crucial to help manage the situation. Synthetic Aperture Radar (SAR) allows observations of wide areas across near all-weather/day-night conditions and plays a significant role in flood detection. Although in many cases smooth water surfaces can be easily extracted by conventional rule-based approaches from SAR amplitude imagery, it is subjected to overestimation of flood extent, especially in the arid and semi-arid regions.
In this regard, other SAR-derived information such as polarimetric decomposition parameters and more advanced data-driven approaches are taken into consideration.
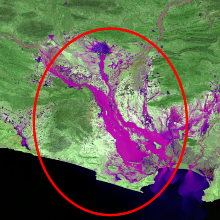
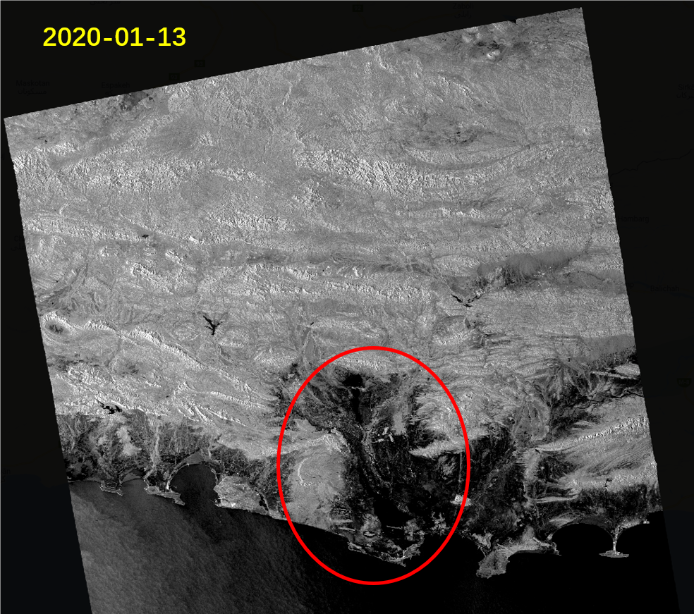
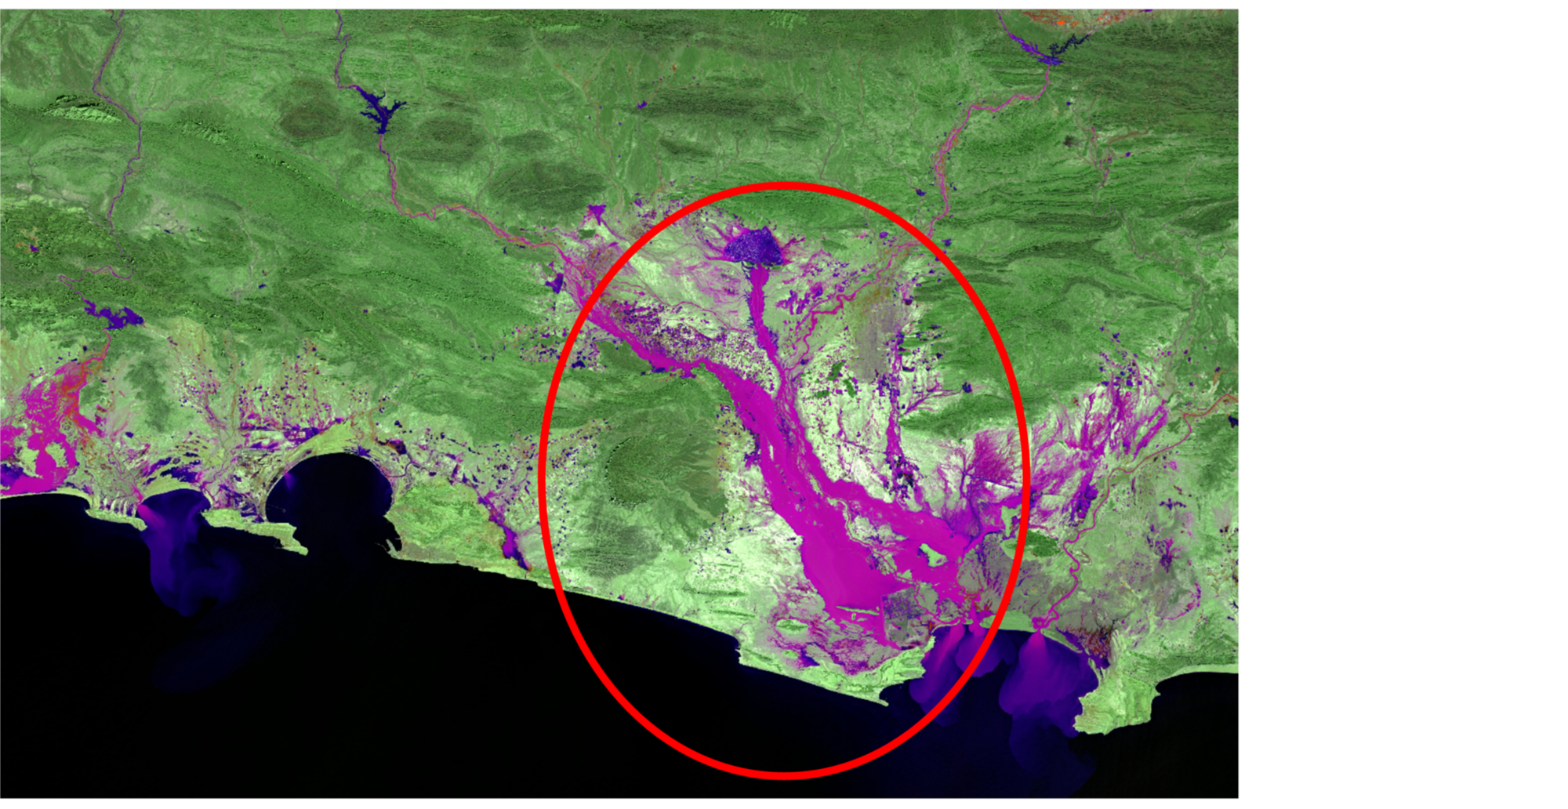
In this thesis we investigate the role of polarimetric decomposition parameters, time series features as well as public label dataset for flood monitoring by a case study in Sistan, Iran (Figure 1 and Figure 2).
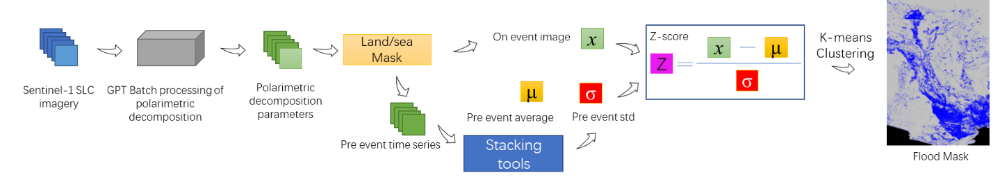
An automatic processing chain of polarimetric decomposition was realized to derive polarimetric decomposition parameters for multi-temporal Sentinel-1 Single Look Complex (SLC) imagery. The time series feature Z-score was then obtained by three different stacks of one-year time series of decomposed parameters in ascending, descending, and all directions respectively.
Regarding the importance of deep learning in remote sending and the need for a globally available labelled data set, we investigate the role of Sen1Floods11, a public remote sensing dataset focusing on flood monitoring. After training a CNN model (ResNet50), the best performing CNN model is firstly tested by images from arid and semiarid region provided in Sen1Floods11, then applied to the subset of the study area as well as two extra test images from Iran.
Methodology
- Polarimetric decomposition and time series analysis
1.1 Polarimetric decomposition
Polarimetric decomposition is to decompose the measured scattering matrix by the SAR system. This technique makes use of both amplitude and phase information in order to better separate different scattering contributions as well as simplify the physical interpretation of SAR observations [1].
For dual-polarized SAR systems such as Sentinel-1, Sentinel Application Platform (SNAP) provides operator to generate covariance matrix (C2) for decomposition.
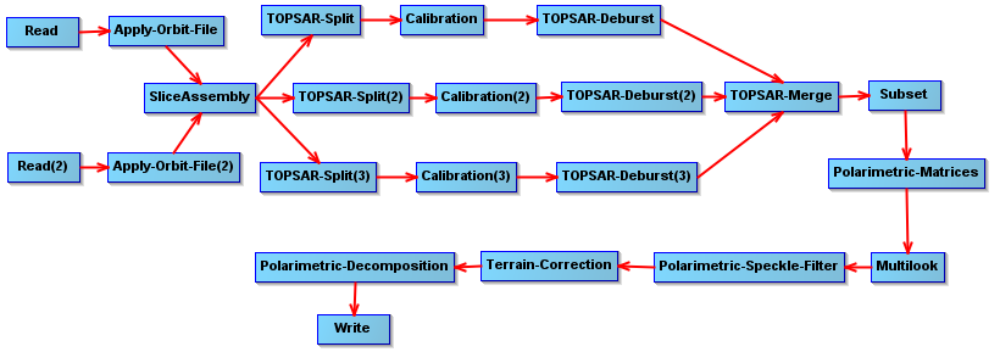
Based on the operators provided by SNAP, we propose an automatic processing chain of polarimetric decomposition for multi-temporal Sentinel-1 imagery (Figure 3). The input should be Sentinel-1 SLC product, and the output should be a three-band image of the polarimetric decomposition parameters. The three bands are Entropy, Anisotropy and Alpha.
1.2 Flood detection by time series analysis
Based on the generation of three polarimetric parameters, the time series analysis can be carried out to determine the features and patterns of the flood. In order to ensure better comparability, a normalization over pre-event time series for each pixel in images at the flood event is applied.
The normalization is applied to three different polarimetric decomposition parameters time series respectively according to the direction of the orbit (ascending, descending, and overall). The whole processing procedure is shown in Figure 4.
- Evaluation of a globally available labelled dataset in flood mapping
2.1 Sen1Floods11 flood events dataset
To support the learning phase of realizing deep learning algorithms for flood monitoring, Sen1Floods11 is introduced as a surface water dataset including raw Sentinel-1 imagery and classified permanent water and flood water [2].
The flood events dataset of Sen1Floods11 consists of eleven flood events happened in different region around the world. The label images were obtained via manual interpretation by analysts based on Sentinel-2 images together with reference Sentinel-2 water classification results created by applying pre-defined threshold to NDVI and modified NDWI respectively. In addition to Sentinel-1 images, Sentinel-2 imagery, the permanent water mask derived from permanent water dataset, and a water extent map extracted by Otsu thresholding algorithm for Sentinel-1 GRD imagery are included for each chip of the training data.
2.2 Training and testing
To evaluate the flood events dataset of Sen1Floods11, a ResNet50 model is built and trained on the dataset. ResNet-50 is a fully convolutional neural network that is 50 layers deep (Figure 5). This network is easier to optimize and can gain accuracy from considerably increased depth [3]. With the help of the architecture that can perform residual learning, the computation load, as well as the processing time, can be reduced without decreasing the performance of the model.

The experiment is performed using PyTorch. The hand labelled flood events data set are divided into training set and validation set randomly according to a ratio of 6:4.
After training, 17 chips from arid and/or semi-arid region which were not used for training are tested to evaluate the model performance. In addition, two test images from another flood event in west Iran are tested.
Results
- Polarimetric decomposition and time series analysis
The final binary flood masks detected by time series analysis of polarimetric decomposition parameters are shown in figure 6 where floodwater is shown in blue and non-flood area is shown in grey.
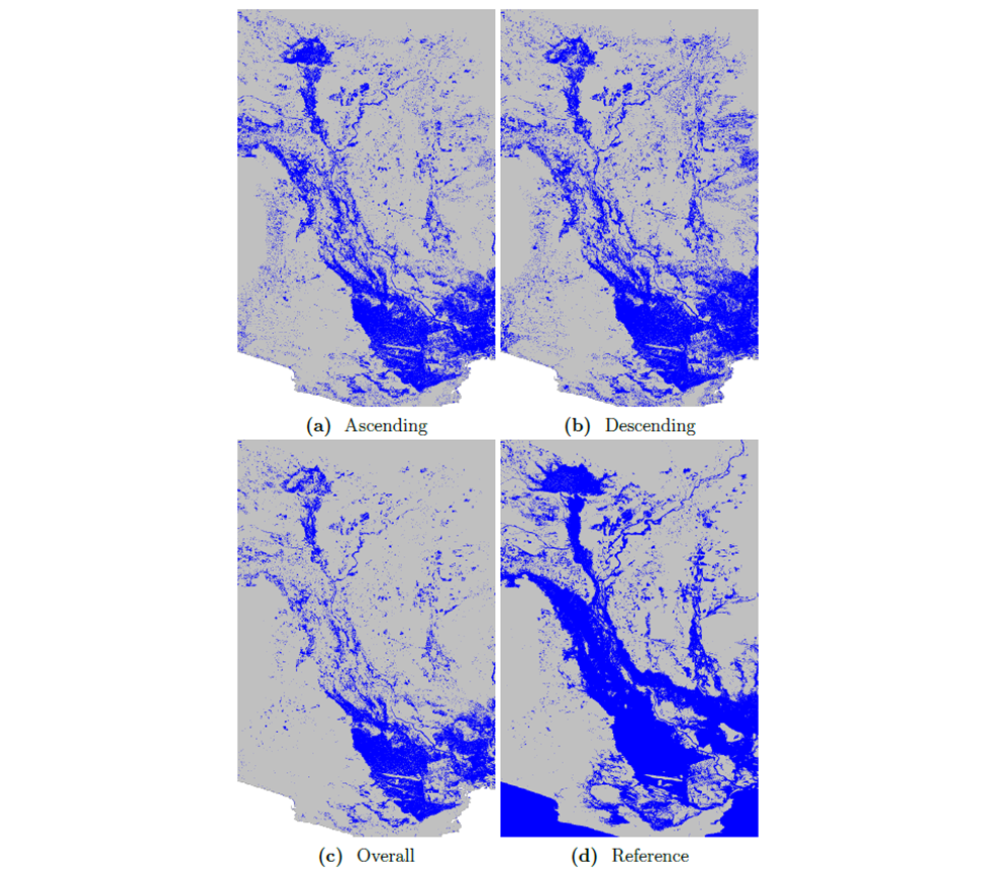
The binary masks of the validation area are shown in Figure 7, with water class shown in blue and non-water class shown in grey. There are some extra pixels from the results obtained by Z-Score images and will be masked out during the calculation of metrics.

Accuracy assessment is performed only for the validation area. Table 1 shows the performance of Z-Score images obtained from different stacks of time series.
Table 1 Accuracy assessment of flood extraction.
|
Metric |
Ascending |
Descending |
Overall |
|
Overall Accuracy |
91.55% |
86.94% |
93.07% |
|
Mean OU |
0.618 |
0.543 |
0.652 |
|
Omission Error |
0.43 |
0.47 |
0.41 |
|
Commission Error |
0.568 |
0.71 |
0.485 |
Conclusions can be drawn from the figures and the table that in this study, the Z-Score derived from overall time series within one year period performs well in flood detection. Also, it’s better to make use of multi-temporal images obtained from the same orbit direction as the image of flood event than those from the opposite direction. Moreover, the time series shows a great potential to extract flood from the regular behavior of the observed surface which may also change the backscatter value in radar imagery.
- Evaluation of a globally available labelled dataset in flood mapping
In order to further explore the competence of this dataset, two Sentinel-1 GRD images from another flood event in western Iran are used.
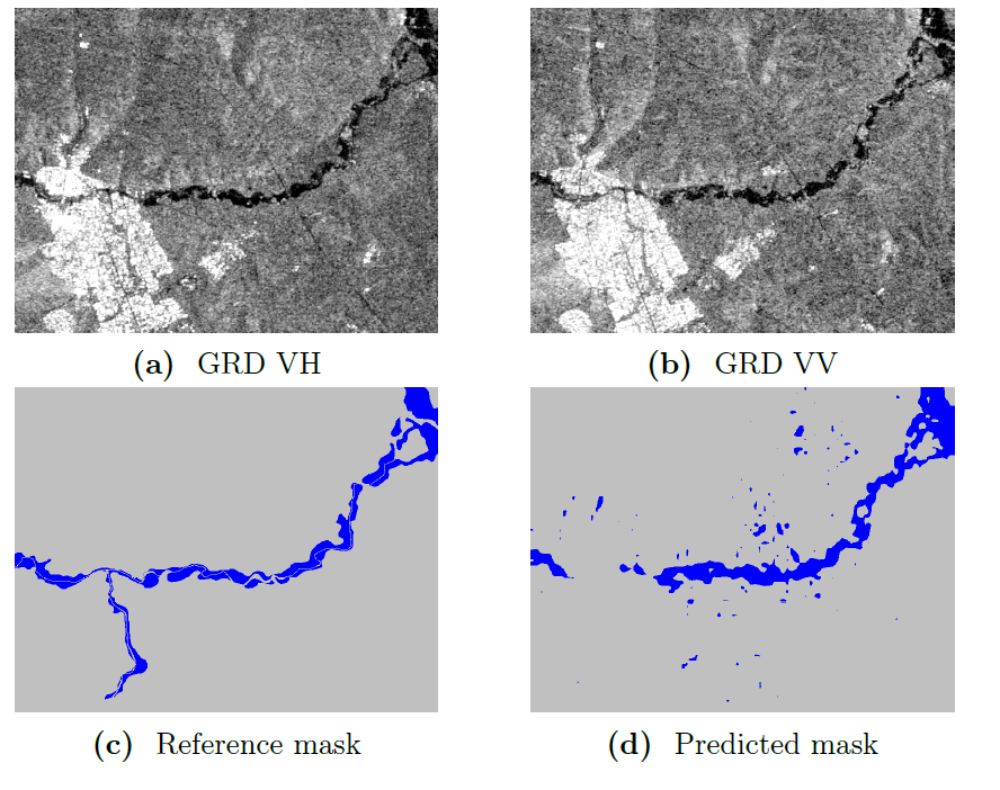
Figure 8 and Figure 9 are the test images (a and b) with respective reference mask (c) and predicted mask (d).
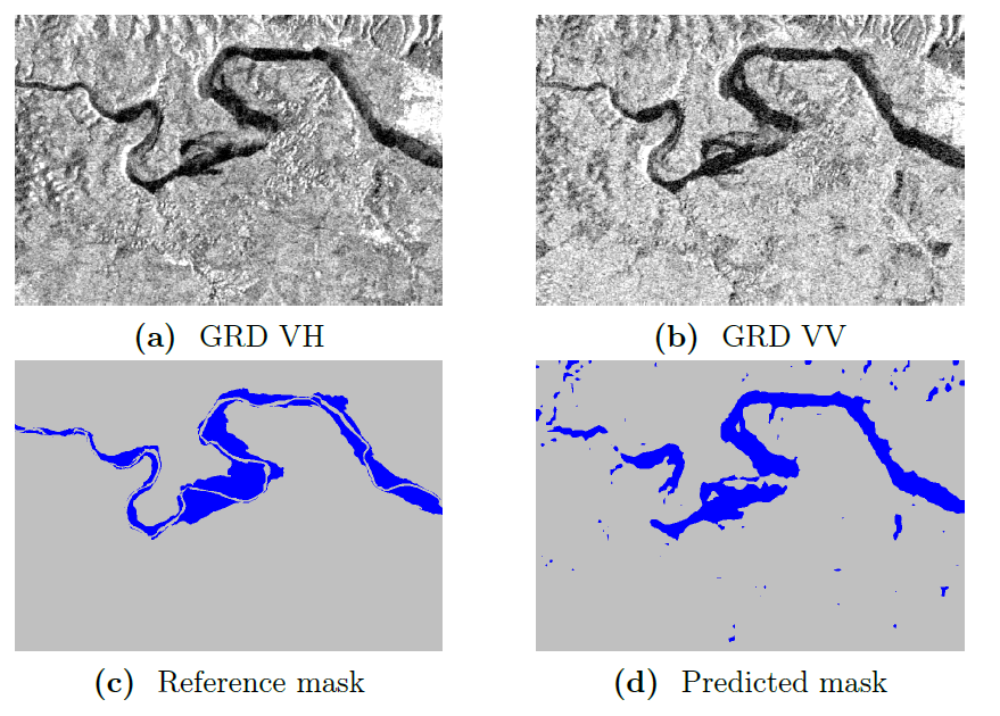
For the test area at Pol Dokhtar (Figure 8), the model performs quite well with an overall accuracy of 95.44%. The IOU of the water class is 0.580, the omission error is 0.1932 and commission error is 0.0331.
For test area at Nurabad (Figure 9), the model achieves an overall accuracy of 96.55%. The IOU of water class is 0.5108, the omission error is 0.2584 and the commission error is 0.0231.
The classification results show the capability of using the CNN and flood water training data to detect flood extent even with small amount of training data. As a public dataset focusing on flood monitoring, Sen1Flods11 dataset provides reasonable training data which is nearly globally distributed. The model performs well on other test images in arid region and shows great confidence in its prediction.
Reference
[1] López-Martínez, C. and E. Pottier (2021). “Basic Principles of SAR Polarimetry”. In: Polarimetric Synthetic Aperture Radar: Principles and Application. Ed. by Irena Hajnsek and Yves-Louis Desnos. Cham: Springer International Publishing, pp. 1–58.
[2] Bonafilia, Derrick et al. (2020). “Sen1Floods11: a georeferenced dataset to train and test deep learning flood algorithms for Sentinel-1”. In: 2020 IEEE/CVF Conference on Computer Vision and Pattern Recognition Workshops (CVPRW), pp. 835–845.
[3] He, K., Zhang, X., Ren, S., & Sun, J. (2016). Deep residual learning for image recognition. In Proceedings of the IEEE conference on computer vision and pattern recognition (pp. 770-778).
Ansprechpartner

Uwe Sörgel
Prof. Dr.-Ing.Institutsleiter, Fachstudienberater