
Nikhil Jose
Integration and Quality Evaluation of Building Groundplans collected by the Crowd
Duration of the Thesis: 6 months
Completion: May 2019
Supervisor: Dr.-Ing. Volker Walter
Examiner: Prof. Dr.-Ing. Uwe Sörgel
Introduction
The objective of this work is to find a way to use the data from the crowd to generate digitized polygons, which meet the required quality conditions. The input data available for the integration was collected by using a crowdsourcing platform called Microworkers (www.microworkers.net). The quality of the input data was not so good because people without any experience about the data digitization did it. So the task was to use this data to get the groundplans of the buildings correctly. The quality of the results after the processing was analyzed by comparing the results with a reference dataset that was done by an expert. A self-evaluating algorithm is also made to give the users a warning about the possibilities of bad results. This allows the users to manually check the results whether it is satisfactory or not in case of warnings.
Methodology
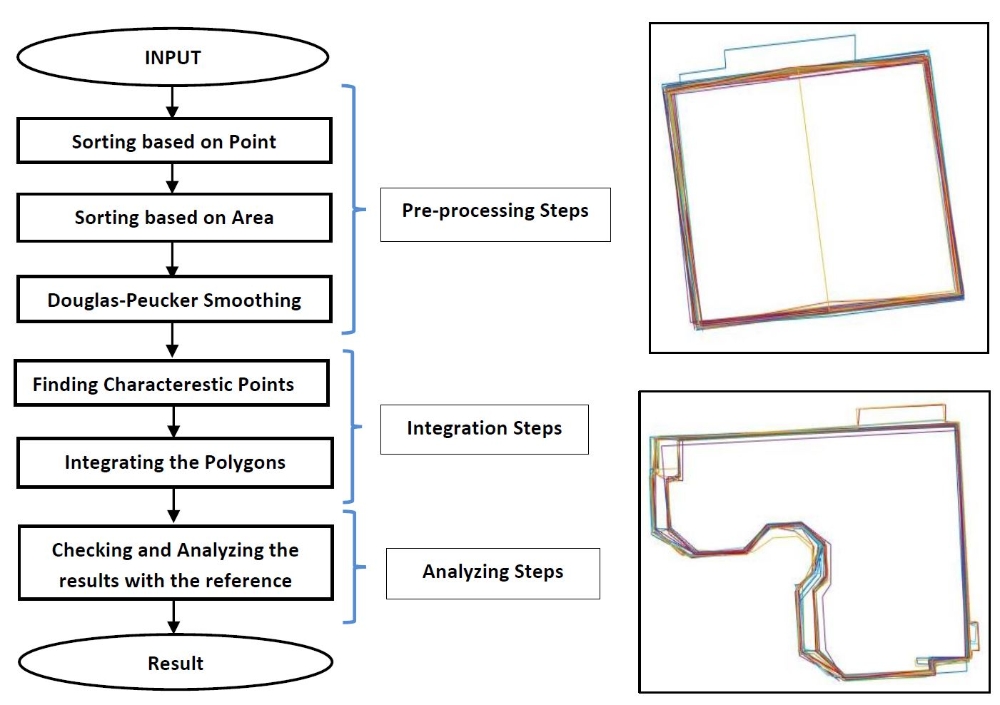
The entire processing steps are divided into three steps. Pre-Processing steps, Integration steps and Analyzing steps. The workflow of this entire process is shown in Figure 1. The input datasets are not usable as such for the integration because of some bad or unusable samples present in the dataset. Some sample Input dataset for the buildings are shown in Figure 2. Therefore, the input data need to be undergoing some preprocessing steps to make the samples usable for the integration. In the preprocessing step, three methods are used to sort out the bad samples based on Area and number of data points.
In the integration phase, the aim is to get one single polygon which represents all the polygons in the dataset or which is the integrated form of all the polygons present in the sample. A strong Douglas-Peucker smoothing algorithm is applied to find some characteristic points to give some control over the result. For the integration, all the points from the data samples are treated as a single point cloud. This point cloud is grouped into different clusters by using a modified k-means clustering method. These points are then joined in the correct order to get
the final result.
Results
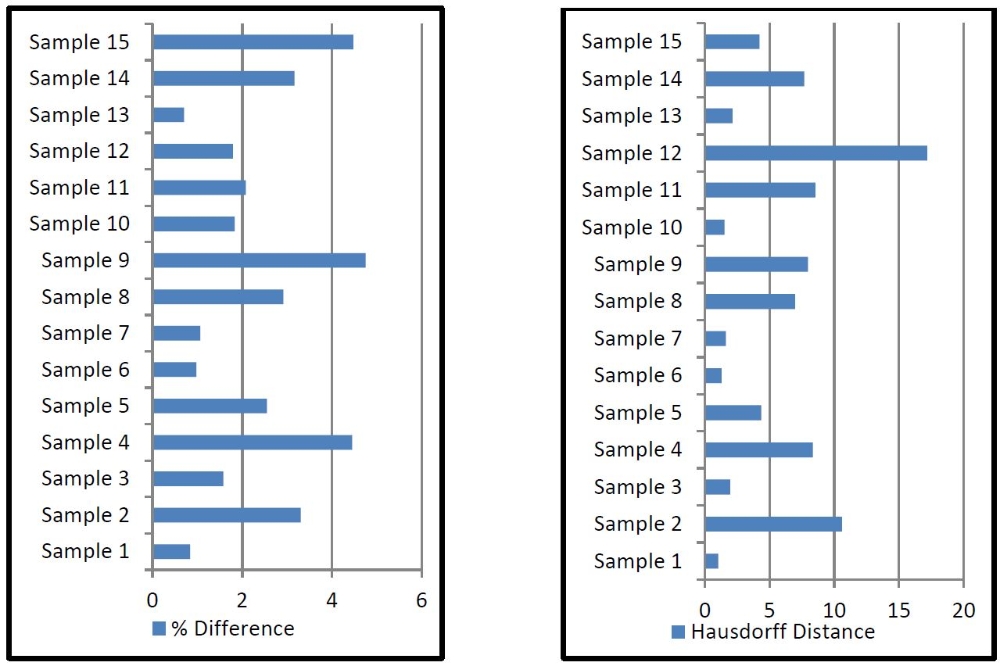
The results of the thesis are the groundplans for the buildings represented as the polygons. Figure 3 shows some sample results obtained after the processing. We can see that the input data improved a lot after the processing to get good results. The analysis of the results were made by using the factors such as Area, Perimeter, Hausdorff distance, Centroidal distance, Number points in the polygon etc. Figure 4 shows the percentage difference in area between each individual samples and the corresponding reference dataset. The maximum difference in the area is below 5%, which is within the limits. In most of the cases, the difference is below 2% which shows the closeness of the results with the reference. Figure 5 shows the Hausdorff distance between the reference and the results. In most of the cases, the Hausdorff distance is below 10 as expected. It is observed that the result usually has the minimum Hausdorff distance than each of the input polygon. This clearly shows the improvement of the data.
The self-evaluating algorithm works in all cases with some sort of problems with the data. Five conditions were made to give the warning to the users. The algorithm gave warning with five samples. In many cases, the warning was about the minor possibilities of the errors. So, the users can check decide on that manually.

Conclusions
- The algorithm is working correctly for most of the samples and we can use this algorithm to get the digitized polygon from the data collected from the public. This is a cheap way to obtain the digitized plans for the buildings rather than hiring an employee.
- The quality checks gave really good results which are as good as the data done by the experts. In case of instances with possible wrong results, the self-evaluating algorithm was giving warnings to the users about the possible errors.
- The quality of the input data affects the results significantly. Therefore, it needs good filtering at the beginning to filter out the good samples.
- The algorithm had some problems with the building having complicated geometry and buildings with a lot of details.
- The orthophotos given to the public for digitization should be optimal. In this case, some faulty orthophotos created confusions for the users and thereby giving bad samples for the integration process. This will ultimately lead to bad results.
Future Work
- The algorithm could be combined with the work of Mr. David Collmar (the input data which was available for this project), to develop an automated algorithm to get the corrected polygons directly from the crowdsourcing platform.
- The same procedure could be repeated by providing the users with perfect orthophotos without many confusions to assess the working of the procedure again. In this case, the results could be better.
References
[1] V. Walter, “Integration of multiple collected polygons with a raster-based approach,” Int.Arch. Photogramm. Remote Sens. Spat. Inf. Sci. - ISPRS Arch., vol. 42, no. 4, pp. 745–749, 2018.
[2] L. Huang, S. Wang, Y. Ye, B. Wang, and L. Wu, “Feature matching in cadastral map integration with a case study of Beijing,” 2010 18th Int. Conf. Geoinformatics, Geoinformatics 2010, no. 2008, 2010.
[3] G. Von Göesseln and M. Sester, “Integration of geoscientific data sets and the German digital map using a matching approach,” Proc. XXth ISPRS Congr., pp. 1249–1254, 2004.
[4] M. Sester, K. H. Anders, and V. Walter, “Linking objects of different spatial data sets by integration and aggregation,” Geoinformatica, vol. 2, no. 4, pp. 335–358, 1998.
[5] A. Schilling, J. Basanow, and A. Zipf, “Vector Based Mapping of Polygons on Irregular Terrain Meshes for Web 3D Map Services,” no. January 2007, pp. 198–205, 2011.
[6] S. Filin and Y. Doytsher, “A linear conflation approach for the integration of photogrammetric information and GIS data,” Proc. XIXth ISPRS Congr., vol. XXXIII, pp. 282–288, 2000.
[7] C. Heipke, “Crowdsourcing geospatial data,” ISPRS J. Photogramm. Remote Sens., vol. 65, no. 6, pp. 550–557, 2010.
[8] S. Mustière and T. Devogele, “Matching networks with different levels of detail,” Geoinformatica, vol. 12, no. 4, pp. 435–453, 2008.
[9] M. F. Goodchild and J. A. Glennon, “Crowdsourcing geographic information for disaster response: A research frontier,” Int. J. Digit. Earth, vol. 3, no. 3, pp. 231–241, 2010.
[10] M. F. Goodchild, “Citizens as sensors: The world of volunteered geography,” GeoJournal, vol. 69, no. 4, pp. 211–221, 2007.
[11] P. Neis, D. Zielstra, and A. Zipf, “The Street Network Evolution of Crowdsourced Maps: OpenStreetMap in Germany 2007–2011,” Futur. Internet, vol. 4, no. 1, pp. 1–21, 2011.
Ansprechpartner

Volker Walter
Dr.-Ing.Gruppenleiter Geoinformatik