Yixia LI
Comparison between PSI and SBAS monitoring – A case study of city subsidence caused by tunnel construction
Duration of the Thesis: 6 months
Completion: September 2018
Supervisor: M.Sc. Chia-Hsiang Yang
Supervisor & Examiner: Prof. Dr.-Ing. Uwe Sörgel
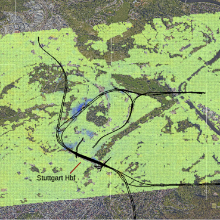
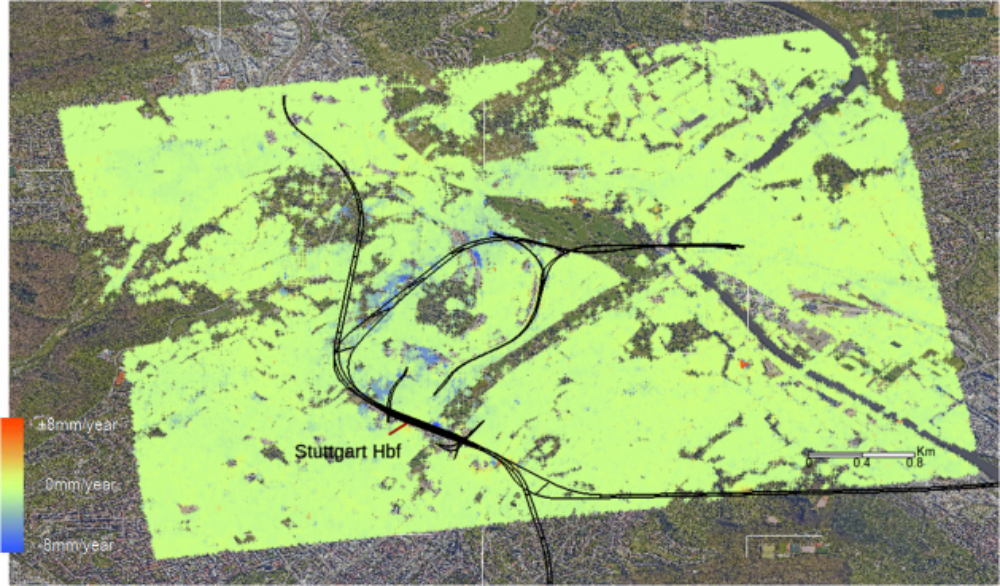
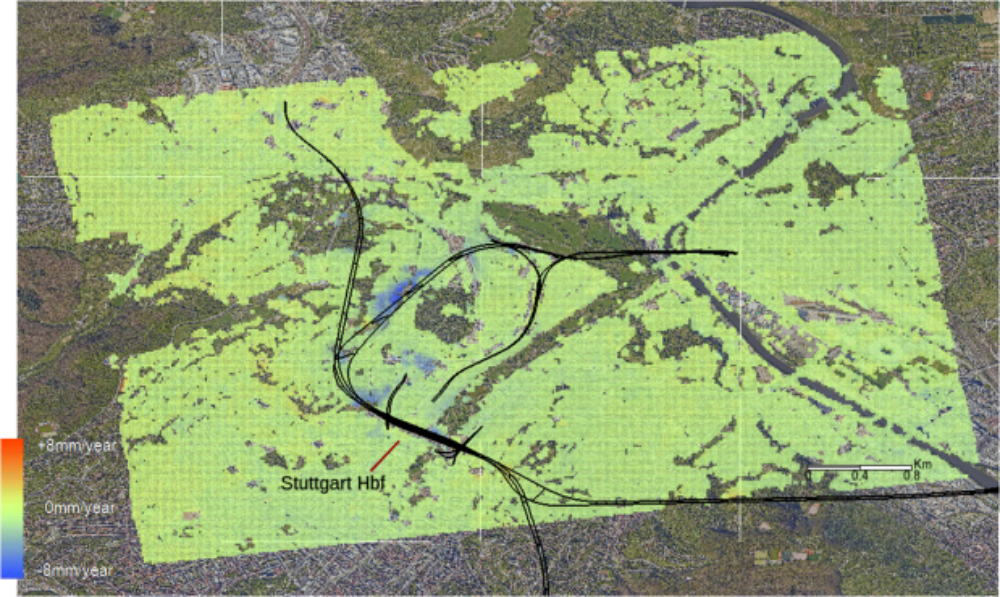
As an example in Stuttgart, the tunnel construction of Stuttgart 21 (S21) is supposed to cause the subsidence of the ground surface. In this paper, we select a study area of 36 square kilometres in Stuttgart centre. Based on the 39 time-series TerraSAR-X images from April 2014 to January 2017, we measure the subsidence of this area and generate the displacement rate map (Figure 1) with two of remote sensing techniques - the Persistent Scatterer Interferometry (PSI) and Small Baseline Subsets (SBAS) technique. From that, the area near the tunnel has the fastest subsidence velocity.
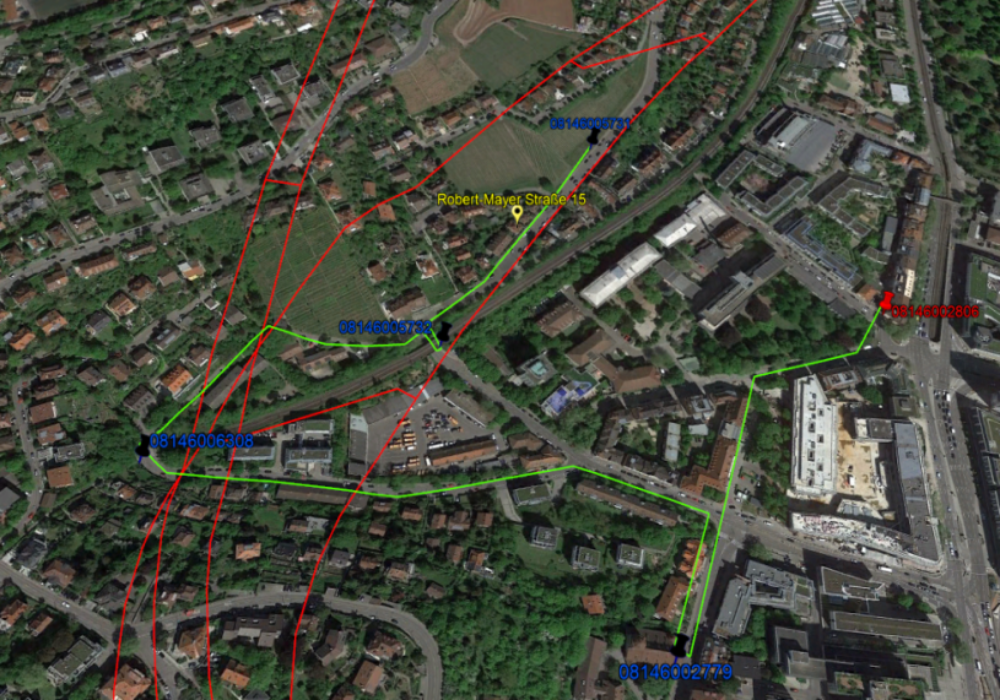
In April 2018, we measured the height of the three control points above the tunnel (Position of control points seen the Figure 2). We compare the subsidence at the nearest point to the control points from PSI and SBAS results. Moreover, we compare the leveling measured height difference on these points with the PSI and SBAS generated average subsidence. At one of the control points, the average displacement here from 2014 to 2017 is nearly -5 mm using remote sensing technique. And the leveling result of this point is -12 mm within 30 years. And we additionally compare the PSI and SBAS subsidence of the house above the tunnel, where a gap between this house and the ground surface occurred in reality. As the results, PSI and SBAS techniques measure the average subsidence here in around 6 mm.
After the comparison of leveling results with the PSI and SBAS results, we select three samples to compare the PSI and SBAS results. One of the samples consists of four circular areas near the tunnel. The other two are the strip sample with 5 km along the tunnel and the rectangular sample with 300 m * 180m on the ground orthogonal to the tunnel. For the group of the small circular areas near the tunnel, both PSI and SBAS techniques have measured the subsidence here from 2014 to 2017 in high precision. Even so, the 3-year maximum difference between PSI and SBAS generated average displacement is just two millimetres. For the transection sample orthogonal to the tunnel direction, the shorter the distance is from the tunnels, the larger is the amount of the subsidence. And the maximum subsidence reaches 8 mm.
Conclusion
According to the above samples of the study in this paper, the tunnel construction of S21 is one of the important reasons for the subsidence of the surrounding ground surface. Man can monitor the sinking of the study area in Stuttgart centre with the PSI and SBAS techniques in millimetre precision. The difference between the results of these two methods is not too much. On the one hand, the PSI technique is more sensitive than the SBAS technique for the subsidence monitoring in urban area. On the other hand, the coverage of the SBAS technique is larger than the PSI technique. Both of them are suitable for the small subsidence monitoring for a long time period.
Ansprechpartner

Uwe Sörgel
Prof. Dr.-Ing.Institutsleiter, Fachstudienberater