Cristian Camilo Cruz Rangel
Comparison and Implementation of Open Source Web Mapping Libraries as a Visualization Tool for the Conflict in Colombia
Duration of the Thesis: 6 months
Completion:November 2017
Supervisor: Dr.-Ing. Volker Walter
Examiner: Prof. Dr.-Ing. Uwe Sörgel
Introduction
Over the last decade Geographic Information Systems among some other technologies have experienced a lot of changes due to different factors, some of them specially important: the development and increasing popularity of Free Open Source Software (FOSS) and the migration of storage, applications and services to the cloud computing infrastructure. All of these technologies have merged to produce as result web mapping, which refer to the production of online maps by making use of web tools, geographical standards as well as data from different sources.
Among a vast number of web mapping tools online, Leaflet and Mapbox GL stand out because they are open sourced, relatively easy to implement, lightweight and actively developed. On the other hand, the increasing popularity of web mapping tools has attracted people from different branches of knowledge due to the cartographic possibilities of these technologies and the growing need of visualizing spatial data derived from all kind of data-driven projects.
This is the case of the Colombian movement around historical memory, which has been gaining strength since the signing of the peace agreement with the FARC guerrillas. People and organizations from different social, academic, journalistic, governmental and other backgrounds have been working in the last year on projects related to the socialization of conflict-related data.
This master thesis is situated between these two domains, since it compares Leaflet and Mapbox GL web mapping libraries showing how these can be implemented in the visualization of spatial-related problems derived from the armed conflict in Colombia as the case of the massive migration of people and the historical track of the perpetrated massacres. It also serves as a guide to people with different knowledge backgrounds who have little technical experience, for implementing these technologies by describing the workflow in developing a web application to map these open datasets.
Library comparison
Both web mapping libraries were compared by performing a pragmatic analysis of some of the characteristics worthy of evaluation from the geomatics point of view:
Tile customization
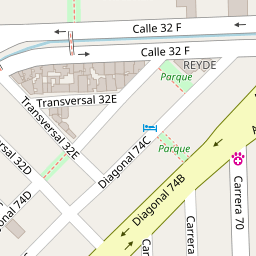
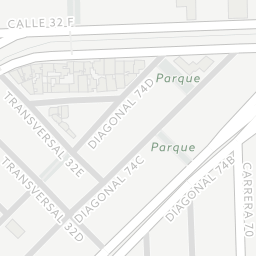
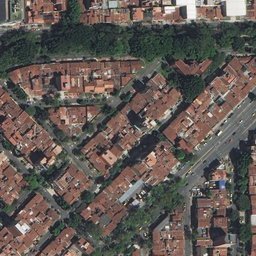
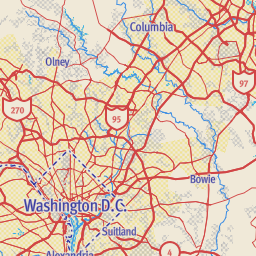
Leaflet supports raster tiles natively. In the raster tile realm, customization is done by pre-rendering the images from different data sources such as OpenStreetMap .OSM files, ESRI shapefiles, PostGIS and .CSV files among others; using software tools such as Mapnik, which allows to render the tiles based on user defined style rules.
 |
 |
 |
| ©OpenStreetMap Carto style |
©CARTO Positron style |
©ESRI World Imagery |
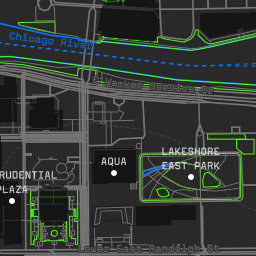
Vector tiles are supported by Mapbox GL and, on the contrary, are easy to customize now that the associated metadata included in the tile can be linked locally on the client-side to an external file to define stroke, background colors and additional visual properties for map features. They also have the ability of extruding buildings to have a 3D effect based on the metadata related to the number of floors, height and shape of building features.
 |
 |
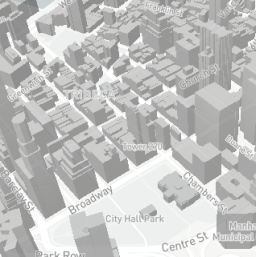 |
| ©Mapbox Standard style | ©Mapbox Terminal style | ©Mapbox Light + 3D |
Tile size
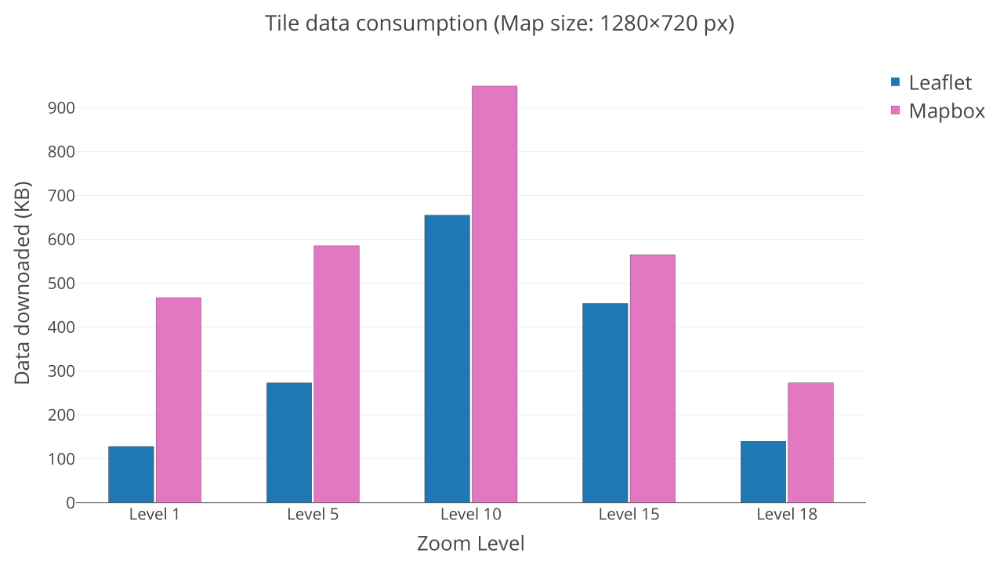
According OpenStreetMap, the carto-style tiles have an average size around 0.63 KB (256×256 pixels PNG files), therefore the complete set of pre-rendered tiles would require about 54 GB of storage.
Vector tiles include geometry and metadata and are encoded with key/value pair assignments to reduce redundancy and file sizes. Providers as Mapbox and Mapzen distribute vector tiles of 512×512 pixels, that means they cover four times the area of raster tiles; additionally vector tiles use the overzooming technique, allowing tiles to use its metadata to render the tiles beyond its zoom level.
The average tile size for different zoom levels was measured, and, as the graph shows, both raster and vector tiles tend to increase their size as zoom increases from minimum level until level 10 then it starts to decrease until level 18 or max zoom level. This behavior is related to the amount of information encoded in the tile itself, for the PNG rasters, it is represented by the pixel colors whereas for vector tiles by geometry and metadata.
Render smoothness
The render smoothness of the tiles is another key feature of the vector tiles compared to raster tiles. Raster tiles zoom vary on a discrete scale now that the image sets are prerendered in zoom levels from 0 to 22 according standards. By contrast, since the vector tile metadata is stored in the client browser, it is used to render the tiles at contiguous zoom levels, the zoom level is continuous and the zooming/panning events run much smoother than raster tiles.
 |
 |
| Leaflet (left) and Mapbox GL (right) tile rendering on zooming event. | |
Support and online communities
One of the main features of FOSS is the large number of people working in software development and maintenance, often in an uncoordinated manner. These communities are composed not only by developers but also by users who voluntarily collaborate in the development and support of tools that are used by themselves or their organizations, playing an important role in the software industry. Both Leaflet and Mapbox GL, being FOSS projects, manage their code versions (repositories) using GitHub. This allows developers and users from all over the world to track and contribute to the development of the open source software not only by merging pieces of code, but also by reporting issues, suggesting new features and sometimes providing support, opening a plenty of room even for non-developers and non-expert users. In general lines, since their release, Leaflet has had more than 6400 commits or updates by 529 contributors while Mapbox GL approximately 7300 updates by 164 contributors.
Leaflet and Mapbox question tags are relevant on Stack Overflow with more than 6000 and 2900 tagged questions, respectively. The site also provides some statistics on the usage of these tags to track them and have some insights about how they trend in time. The figure below presents the trends of both technologies in terms of questions tagged on the site. It can be seen the rise on popularity of leaflet since 2012 until now, almost reaching the 0.09% of all the questions in a month, compared with Mapbox, which is almost over the 0.03%. This is a good estimate of how likely is finding help for developers and people using these technologies.
The intensity of both displacement and reception of people in different municipalities was mapped using a heatmap as technique.
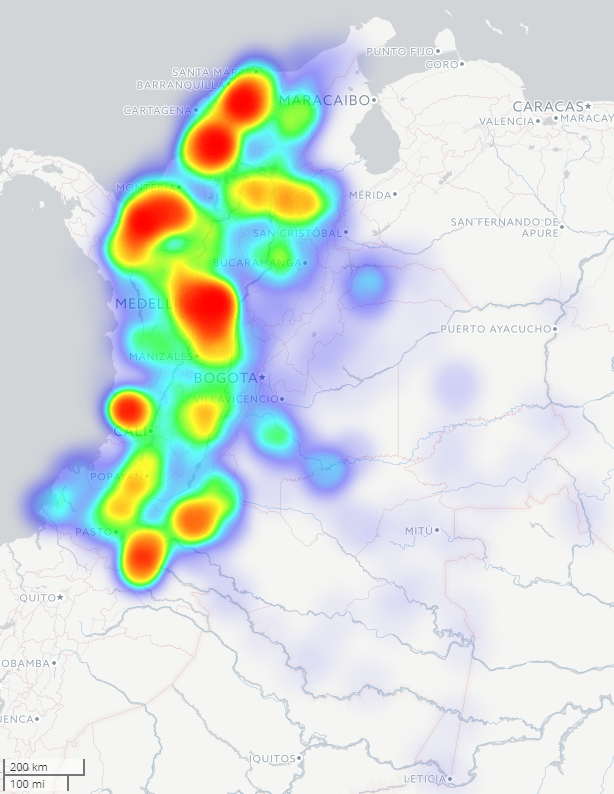 |
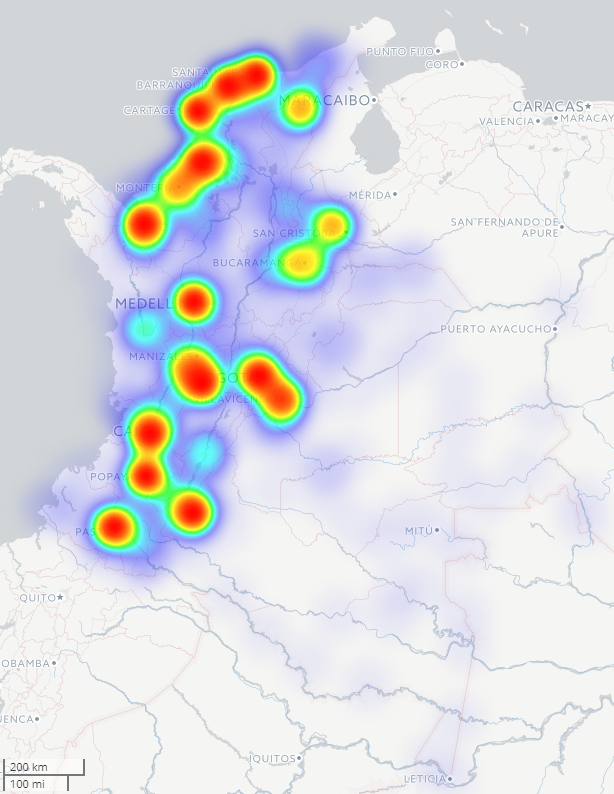 |
| Displacing municipality intensity. | Receiving municipality intensity. |
Finally, the historical massacres dataset is mapped and linked to the website of Rutas del Conflicto, where specific information can be accessed and reported as well.

Mapbox GL + D3.js web application
The Mapbox web map application is developed to demonstrate the capabilities of Mapbox GL as web mapping library combined with the prominent performance of D3.js to draw data-driven SVG elements on the web documents. Both libraries were used in order to present another web mapping alternative to the Leaflet's flow map as well as a different approach to achieve the migration visualization.
Conclusions
The implementation of web mapping technologies is relevant in the sense that they have been and continue to be used and developed by interdisciplinary groups due to the imperative need to visualize geographic data. This is why it is pertinent to make them accessible and easy to use, especially when many of the people involved in these types of projects do not have the technical knowledge to implement them. In this regard, the web application developed in this master thesis is a clear example of the possibilities offered by these web technologies to move from the presentation of tables to interactive and dynamic web maps, "making the invisible visible, which in turn provide much clearer information especially to the inexperienced users. Additionally, by making the code and its instructions available to the public, it is expected to motivate and encourage new users to make use of web maps.
After comparing the types of tiles, it could be observed that, although vector tiles have notably improved the quality, presentation, design and loading speed of web maps, their use has not been popularized especially due to the lack of support of Mapbox GL for different types of style, the lack of online help communities, third-party plugins and especially the lack of well-documented examples that bring new users closer to the library making its use easier. Nevertheless, given the rapid development of Mapbox GL, and the adoption of vector web maps by different leading companies and organizations from diverse sectors such as data analysis, business intelligence, logistics and travel, its usage is likely to be equivalent Leaflet's popularity as web mapping library in the near future.
Similarly, it was observed that the comparison between the two libraries proposed in terms of their performance and their possibilities of use is difficult to evaluate, as both make use of different types of web technologies. However, parameters such as the speed of transmission and rendering, the offer of plugins, the possibility of customization as well as the popularity and availability for online support, were analyzed. These results can be of great help when choosing between the implementation of one or another technology.
Considering that this master thesis aimed to the development of a web mapping application to visualize the migration and massacres patterns in Colombia due to the conflict the results were satisfactory; moreover this master thesis describes the workflow in mapping open data from government organizations and NGOs. Different third-party tools and plugins for both Leaflet and Mapbox libraries were also presented as alternatives for mapping different types of processes, emphasizing on code implementation for later reproduction or use.
Making data analysis useful for design and planning --in this case public policies-- has shifted from data collection as main task to extracting relevant information and knowledge that serves as the basis for decision-making. In this way, the developed web application is a clear example of a data-based product that serves for the so-called "computational evidence informed planning" which is a cornerstone in the generalization of insights from the analysis of existing information for a more suitable future planning.
The use of computational technologies for visualizing information is an imperative necessity in the process chain related to any data analysis project. In this sense, many efforts are being made in the creation of tools for user-friendly implementation, such is the case of upcoming technologies such as Observable or Tableau and the appearance of several Massive Open Online Courses (MOOCs) related not only to computer programming and data science but also focused on data visualization.
A plausible side project derived from this work is linked to the future offer of web mapping workshops in collaboration with the team of Rutas del Conflicto. It is expected to have the participation of professionals from different disciplines as well as valuable feedback to help to the improvement of the examples presented in this thesis and the possible implementation of web mapping techniques in other projects related to the conflict in Colombia.
Ansprechpartner

Volker Walter
Dr.-Ing.Gruppenleiter Geoinformatik